Figures & data
Table 1. Primer sequences used in RT-PCR.
Figure 2. Effect of Tf-EE on transcriptional activation during TLR signaling. (A) mRNA levels of iNOS, COX-2, and IL-1β in RAW264.7 cells were measured by RT-PCR. (B) NF-κB activation was determined in NF-κB Luc and β-gal plasmid co-transfected HEK293T cells in the absence or presence of CFP-TRIF or Flag-MyD88. Luciferase activity was measured using a luminometer. (C) The levels of p65, p50, and lamin A/C in the nuclear fraction were determined by immunoblotting. NF: nuclear fraction. *p < 0.05 and **p < 0.01 compared with control.
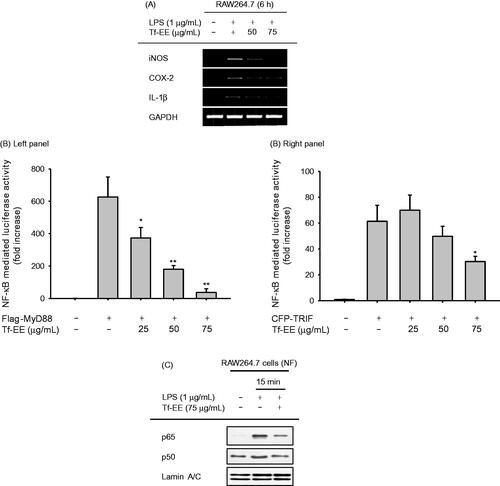
Figure 3. Effect of Tf-EE on the NF-κB activation signaling cascade. (A and B) The levels of total protein and phosphoprotein of IκBα, AKT, Syk, Src and β-actin in the whole cell lysates were determined by immunoblotting. (C) HA-Src plasmid transfected HEK293T cells were treated with Tf-EE. The levels of p-Src, HA, p-p85, p85 and β-actin in whole cell lysates were determined by immunoblotting. (D) Flag-MyD88 plasmid-transfected HEK293T cells were treated with Tf-EE. The levels of Flag, p-Src, Src and β-actin in whole cell lysates were determined by immunoblotting. (E) The levels of molecular complexes between Src and p-p85 were measured in LPS-induced RAW274.7 cells with Tf-EE treatment by immunoblotting after immunoprecipitation. (F) A Src inhibitor, PP2, was pretreated on the LPS-treated RAW264.7cells. NO levels were measured via Griess assay. *p< 0.05 and **p< 0.01 compared with control.
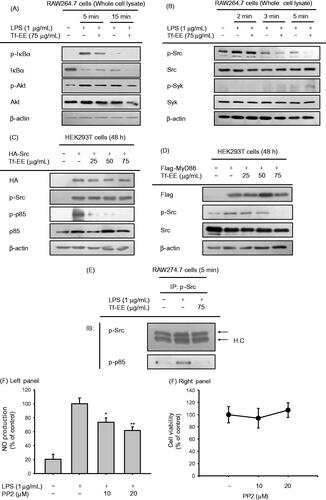
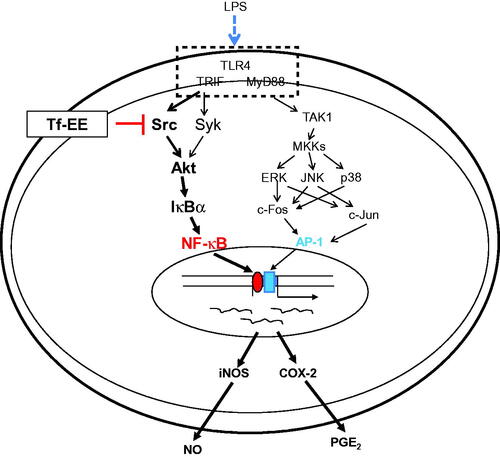
Figure 4. Putative inhibitory pathway of LPS-activated inflammatory responses mediated by Tf-EE.