
Figures & data
Figure 1. Body weight for male Sprague–Dawley rats for colon cancer chemopreventive study.
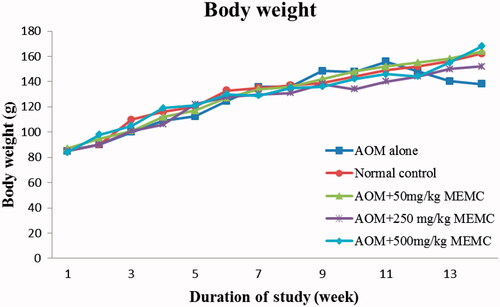
Figure 2. (a) Normal histoarchitecture of rat colon; (b) AOM control group; (c) section of colon tissue treated with AOM + 50 mg/kg MEMC; (d) section of colon tissue treated with AOM + 250 mg/kg MEMC; (e) section of colon tissue treated with AOM + 500 mg/kg MEMC (I – Infiltration of inflammatory cells. Black arrow – Aberrant crypt foci) (100 × magnification).
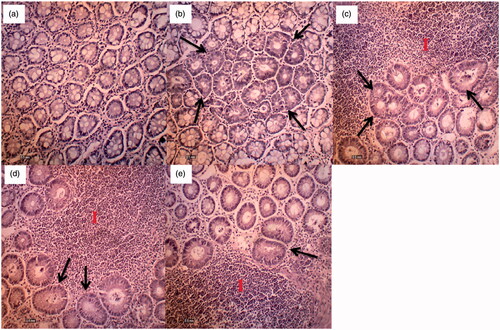
Table 1. Effect of MEMC on relative organ weigh (ROW) in AOM-treated rats.
Table 2. The incidence of aberrant crypt foci (ACF) found in rats colon induced by azoxymethane (AOM).
Table 3. Effect of antioxidant enzymes in the colons of rats subjected to MEMC treatment.
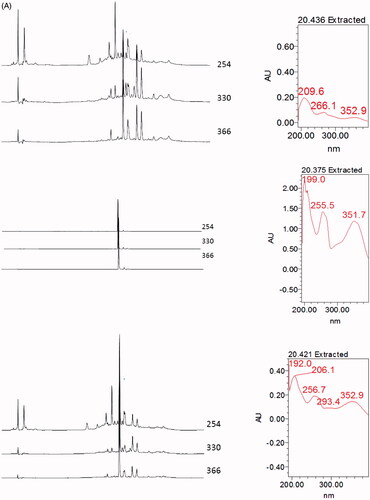
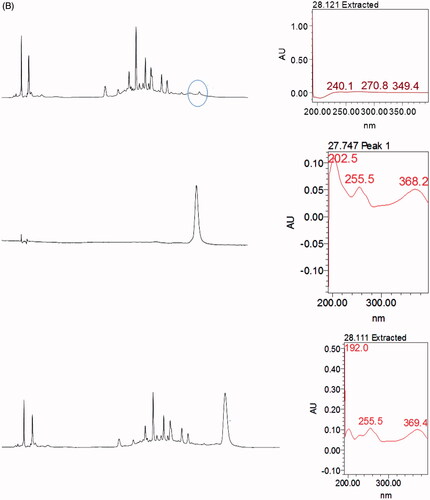
Figure 4. Total ion chromatography (TIC) of MEMC obtained using the UHPLC instrument in negative ion mode.
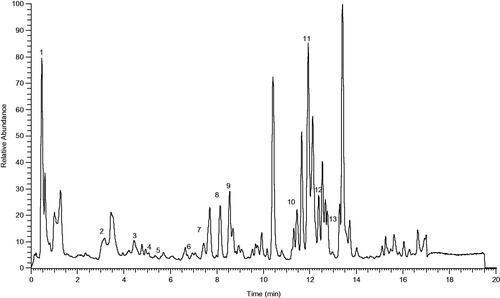
Table 4. Phenolic compounds identified in MMCL by UHPLC-MS.