Figures & data
Table 1. 1H (400 MHz) and 13C (100 MHz) NMR spectroscopic data of compound 1 in CDCl3.
Figure 1. Chemical structures of the compounds isolated or identified from H. sitiens fractions B3b3M (1) and B3b3J (2 and 3).
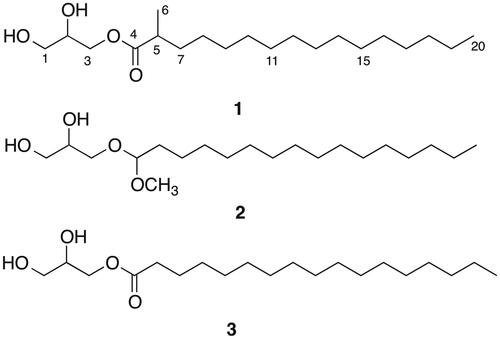
Figure 2. Key HMBC (H→C) and 1H-1H COSY (—) correlations of compound 1.
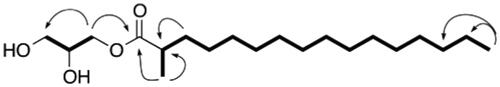
Figure 3. The effects of H. sitiens fractions on DC secretion of IL-12p40, IL-6 and IL-10. DCs were matured and activated by TNF-α, IL-1β and LPS in the absence (solvent control (CT)) or presence of fractions B3b3F–B3b3P (F–P) for 24 h. The supernatants were collected and the concentrations of IL-12p40 (A), IL-6 (B) and IL-10 (C) were determined by ELISA. The data are presented as SI, i.e. the concentration of each cytokine in the supernatant of cells matured and activated in the presence of fractions divided by the concentration of the cytokine in the supernatant of cells matured and activated in the absence of fractions. The results are shown as mean + SEM, n = 6–8. Different from CT: *p < 0.05, **p < 0.01, ***p < 0.001.
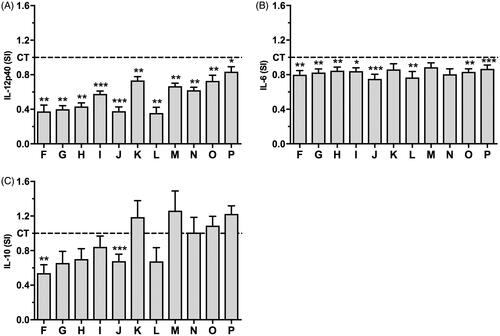
Figure 4. The effects of H. sitiens fractions on the ability of DCs to induce cytokine secretion by allogeneic CD4+ T cells. DCs matured and activated in the absence (solvent control (CT)) or presence of fractions B3b3F (F), B3b3J (J) and B3b3P (P) at a concentration of 10 µg/mL for 24 h were co-cultured with isolated allogeneic CD4+ T cells for 6 d and the concentration of IFN-γ, IL-17 and IL-10 in the supernatants determined by ELISA. The data are presented as SI, i.e. the concentration of each cytokine in the supernatant of cells treated with fractions divided by the concentration of each cytokine in the supernatant of cells treated with solvent control. The results are shown as mean + SEM, n = 6. Different from CT: **p < 0.01.
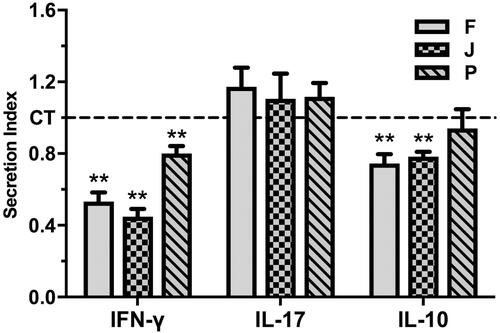
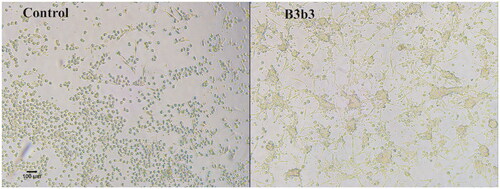
Figure 5. The effect of H. sitiens fraction B3b3 on DC morphology. DCs were matured and activated in the presence of fraction B3b3 at a concentration of 10 µg/mL or solvent control (control) for 2 h and viewed in light microscope. 10× magnification. Scale bar 100 µm.