Figures & data
Table 1. Gradient composition of the mobile phase for HPLC analysis of SPE.
Figure 1. HPLC plots of standard solution (a) and SPE (b). The peaks are identified as: rosmarinic acid (1), salvianolic acid B (2).
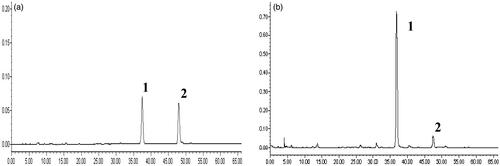
Figure 2. The effect of SPE administration on UP excretion. N: normal control group; M: model group; TG: control medicine group (15 mg/kg TG i.g.); SPE1: low dose treatment group (50 mg/kg SPE i.g.); SPE2: medium dose treatment group (100 mg/kg SPE i.g.); SPE3: high dose treatment group (200 mg/kg SPE i.g.). #p < 0.05, ##p < 0.01, compared with N group; *p < 0.05, **p < 0.01, compared with M group.
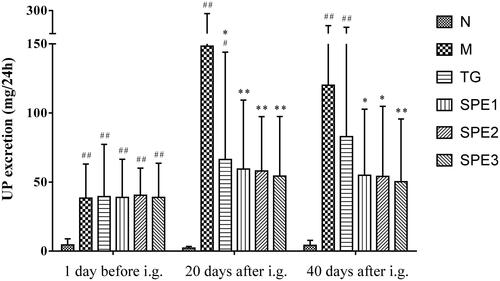
Figure 3. The effect of SPE administration on KWMC. N: normal control group; M: model group; TG: control medicine group (15 mg/kg TG i.g.); SPE1: low dose treatment group (50 mg/kg SPE i.g.); SPE2: medium dose treatment group (100 mg/kg SPE i.g.); SPE3: high dose treatment group (200 mg/kg SPE i.g.). ##p < 0.01, compared with N group; *p < 0.05, compared with M group.
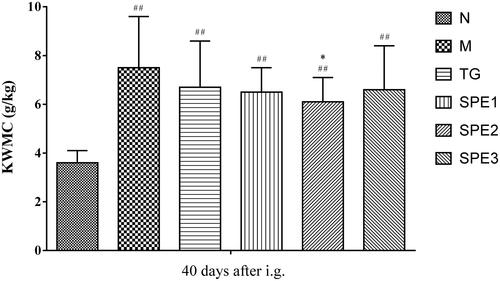
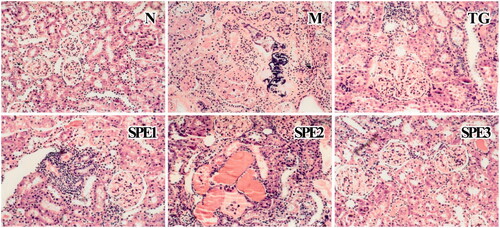
Figure 5. Light micrographic changes of the kidney specimens (stained with HE, 10 × 20). N: normal control group; M: model group; TG: control medicine group (15 mg/kg TG i.g.); SPE1: low dose treatment group (50 mg/kg SPE i.g.); SPE2: medium dose treatment group (100 mg/kg SPE i.g.); SPE3: high dose treatment group (200 mg/kg SPE i.g.).