Figures & data
Figure 1. Clinical signs observed in mice following challenge test with the allergen (β-Lg). Data are mean ± SE (standard error). (###p < 0.001 compared with unsensitized mice (CL−). ***p < 0.001 compared with positive control mice (CL+); n = 10 per group).
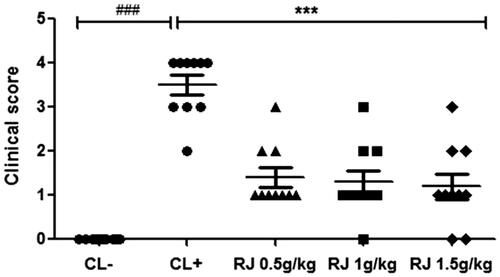
Figure 2. Body temperature of Balb/c mice after β-Lg challenge. Rectal temperatures were measured 30 minutes after IP challenge with β-Lg. Data are mean ± SE (standard error). (###p < 0.001 compared with unsensitized mice (CL−). ***p < 0.001 compared with positive control mice (CL+); n = 10 per group).
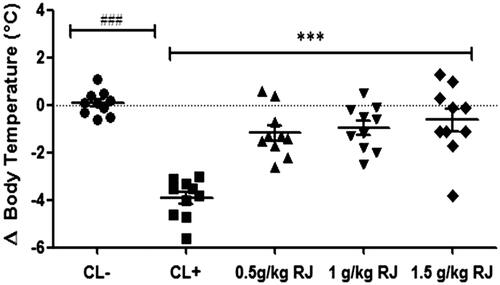
Figure 3. Histamine concentration was determined by enzyme immunoassay kit and represented as plasma concentration (nM). Data are mean ± SE (standard error). (###p < 0.001 compared with unsensitized mice (CL−). **p < 0.01; ***p < 0.001 compared with positive control mice (CL+); n = 10 per group).
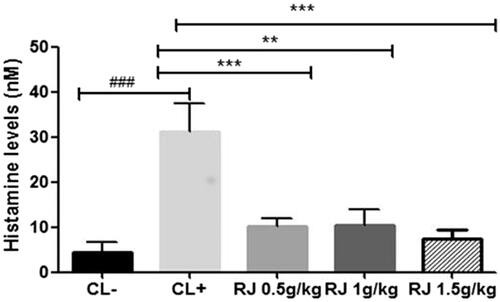
Figure 4. Effect of royal jelly administration on IgG (a) and IgE (b) titers in response to β-Lg sensitization. Data are mean ± SE (standard error). (###p < 0.001 compared with unsensitized mice (CL−). **p < 0.01; ***p < 0.001 compared with positive control mice (CL+); n = 10 per group).
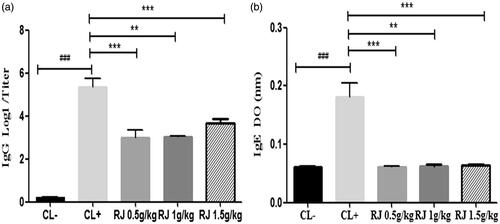
Figure 5. Effect of β-Lg on the short circuit current (Isc) in Ussing chamber measured in mouse jejunal fragments sensitized intraperitoneally with β-Lg previously treated or not with royal jelly. Data are expressed as mean ± SE (n = 10) (**p < 0.01 and ***p < 0.001).
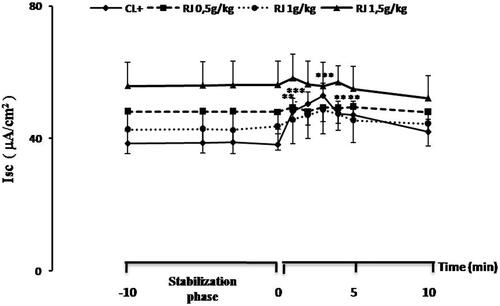
Figure 6. Effect of β-Lg on conductance (G) in Ussing chamber measured in mouse jejunal fragments sensitized intraperitoneally with β-Lg previously treated or not with royal jelly. Data are expressed as mean ± SE (n = 10) (**p < 0.01 and ***p < 0.001).
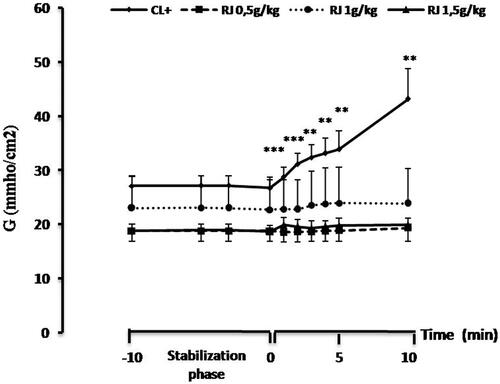
Table 1. Effect of royal jelly on Isc (a) and conductance (b) values after β-Lg challenge.
Figure 7. Light microscopy (G × 10) showing intestinal villi stained with haematoxylin–eosin. Jejunal tissues were obtained from naive mice (CL−) (a), β-Lg-sensitized mice (CL+) (b) and mice received royal jelly for seven days at the respective doses of 0.5 (c), 1 (d) and 1.5 g/kg (e) and then sensitized intraperitoneally with β-Lg.
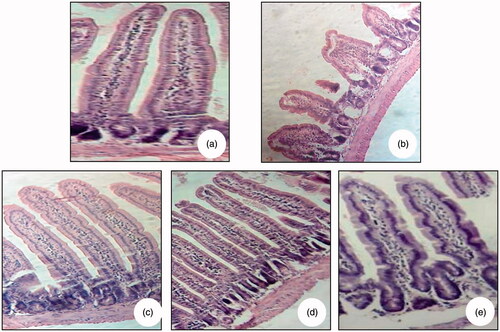
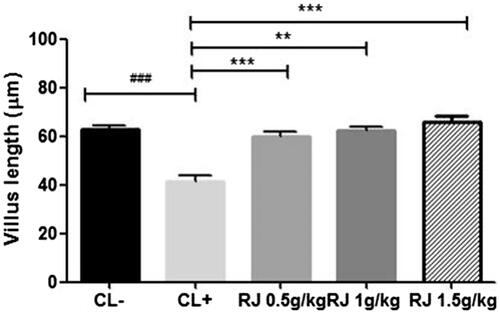
Figure 8. Evaluation of the villus height fragments of jejunum of mice received royal jelly for seven days at the respective doses of 0 (positive control), 0.5, 1 and 1.5 g/kg and then sensitized intraperitoneally with β-Lg. Data are mean ± SE (standard error). (###p < 0.001 compared with unsensitized mice (CL−). **p < 0.01; ***p < 0.001 compared with positive control mice (CL+); n = 10 per group).