Figures & data
Table 1. Effect of rutin (RUT) on body weight, absolute and relative organ weights of the liver and kidney of rats after co-exposure to cadmium and ethanol (Cd + EtOH).
Table 2. Effect of rutin (RUT), ethanol (EtOH), and cadmium (Cd) co-exposure on serum Cd level and marker enzymes of hepatic function in rats.
Figure 1. Effects of rutin (RUT), ethanol (EtOH) and cadmium (Cd) co-exposure on rat liver oxidative stress markers (a) malondialdehyde (MDA), (b) reduced glutathione (GSH), (c) catalase (CAT), (d) glutathione peroxidase (GSH-Px), (e) superoxide dismutase (SOD), (f) glutathione-S-transferase (GST). Data are presented as the mean ± SD (n = 5). Bars with different alphabets are significantly different (p < 0.05).
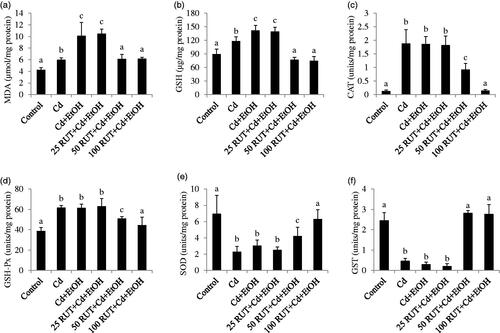
Figure 2. Effects of rutin (RUT), ethanol (EtOH) and cadmium (Cd) co-exposure on oxidative stress markers in rat serum (a) malondialdehyde (MDA), (b) reduced glutathione (GSH), (c) catalase (CAT), (d) glutathione peroxidase (GSH-Px), (e) superoxide dismutase (SOD), (f) glutathione-S-transferase (GST). Data are presented as the mean ± SD (n = 5). Bars with different alphabets are significantly different (p < 0.05).
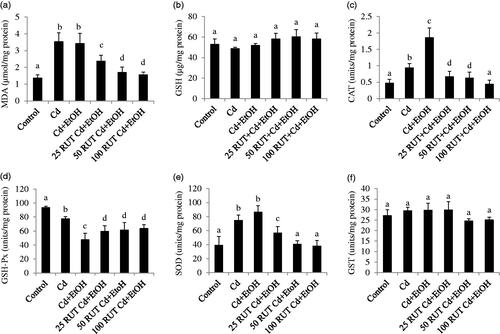
Figure 3. Effects of rutin (RUT), ethanol (EtOH) and cadmium (Cd) co-exposure on rat kidney oxidative stress markers (a) malondialdehyde (MDA), (b) reduced glutathione (GSH), (c) catalase (CAT), (d) glutathione peroxidase (GSH-Px), (e) superoxide dismutase (SOD), (f) glutathione-S-transferase (GST). Data are presented as the mean ± SD (n = 5). Bars with different alphabets are significantly different (p < 0.05).
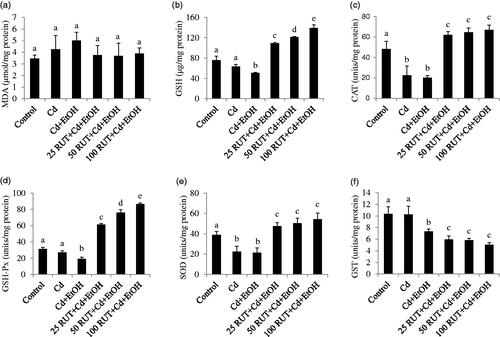
Figure 4. Effects of rutin (RUT), ethanol (EtOH) and cadmium (Cd) co-exposure on serum (a) cholesterol level (b) bilirubin level and (c) uric acid level in rats. Data are presented as the mean ± SD (n = 5). Bars with different superscript are significantly different (p < 0.05).
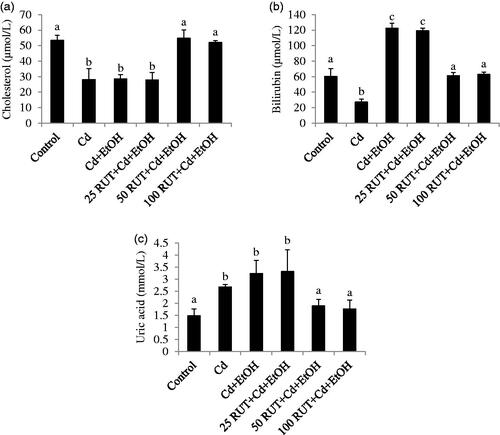
Figure 5. Representative photomicrographs from the liver showing the protective effect of RUT against Cd + EtOH-induced hepatic injury in rats. (a) Control: No visible lession seen (b) Cd: There is mild diffuse degeneration of hepacytes (arrows). (c) Cd + EtOH: There is a severe diffuse hydropic degeneration of hepatocytes (arrows). (d) 25 RUT + Cd + EtOH: Severe central venous congestion and periportal cellular infiltration by mononuclear cells and degeneration of hepatocytes (arrows). (e) 50 RUT + Cd + EtOH: No visible lesion seen (F) 100 RUT + Cd + EtOH: No visible lesion seen. H & E; mag ×400.
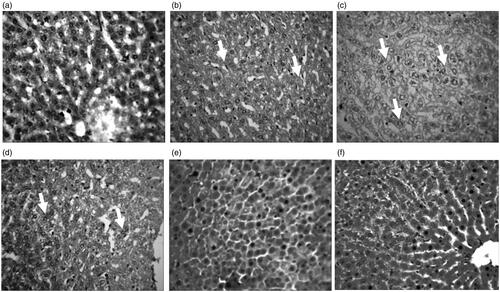
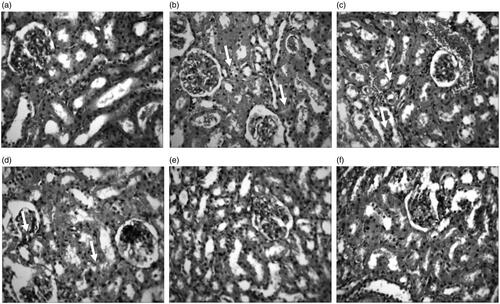
Figure 6. Representative photomicrographs from the kidney showing the protective effect of RUT against Cd + EtOH-induced renal injury in rats. (a) Control: No visible lesions seen (b) Cd: There is a diffuse tubular and glomerular degeneration (small arrows). (c) Cd + EtOH: Severe renal cortical congestion and diffuse tubular and glomerular degeneration (small arrows). (d) 25 RUT + Cd + EtOH: severe glomerular degeneration and necrosis (arrows). (e) 50 RUT + Cd + EtOH: No visible lesions seen (f) 100 RUT + Cd + EtOH: No visible lesions seen. H & E; mag ×400.