Figures & data
Figure 1. The chemical structures of major components in total glucosides of peony.
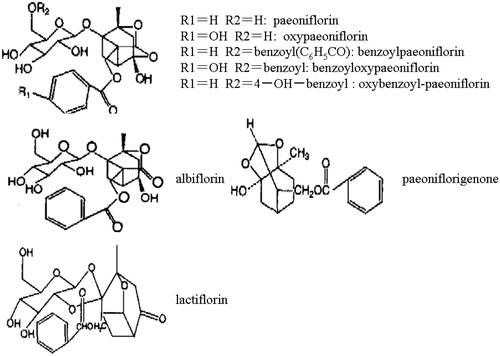
Figure 2. HPLC fingerprinting of total glucosides of peony. (1) Albiflorin; (2) paeoniflorin. Column: Supelcosil LC-18 (5 µm, 150 mm × 4.6 mm); solvent A: acetonitrile; solvent B: H20 (acidified to pH 3.0 with phosphoric acid); gradient: 10, 15, 18, 30, 35 and 40% of solvent A at 0, 5, 25, 27, 38, 40 and 50 min, respectively. Flow rate: 1.0 mL/min. Injection volume: 10 µL. Detection: 230 nm.
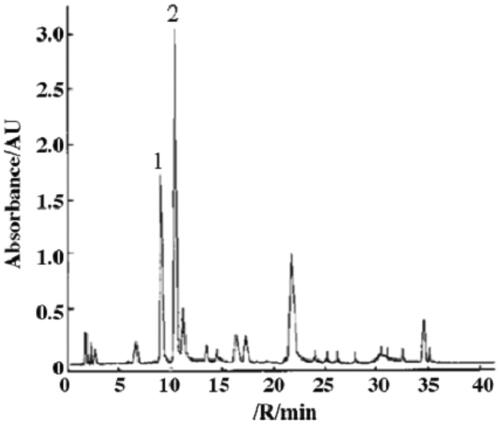
Table 1. Effects of TGP on triglycerides, and total cholesterol and free fatty acids in liver of diabetic rats induced by STZ.
Table 2. Effects of TGP on serum ALT and AST levels of diabetic rats induced by STZ.
Table 3. Effects of TGP on triglycerides, and total cholesterol and free fatty acids in liver of diabetic rats induced by STZ.
Figure 3. Histological examination of liver in HE staining. (A) Normal; (B) control diabetic; (C) diabetic + TGP 50 mg/kg; (D) diabetic + TGP 100 mg/kg; (E) diabetic + TGP 200 mg/kg. Original magnification 100×.
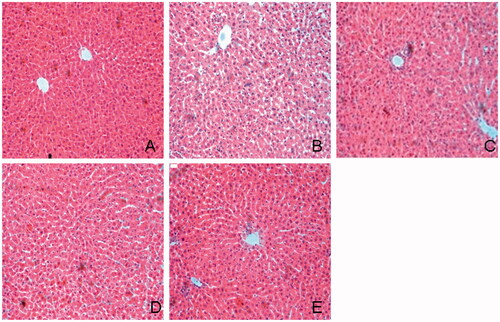
Figure 4. Histological examination of liver in Oil red O staining. (A) Normal; (B) control diabetic; (C) diabetic + TGP 50 mg/kg; (D) diabetic + TGP 100 mg/kg; (E) diabetic + TGP 200 mg/kg. Original magnification 100×.
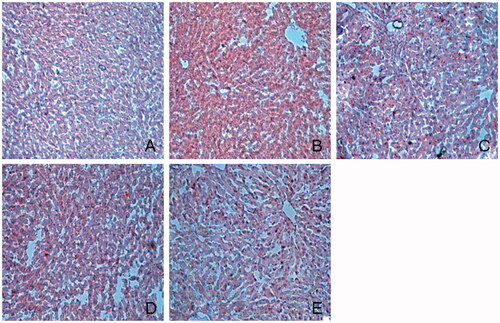
Figure 5. Histological examination of liver in Masson’s trichrome staining. (A) Normal; (B) control diabetic; (C) diabetic + TGP 50 mg/kg; (D) diabetic + TGP 100 mg/kg; (E) diabetic + TGP 200 mg/kg. Original magnification 100×.
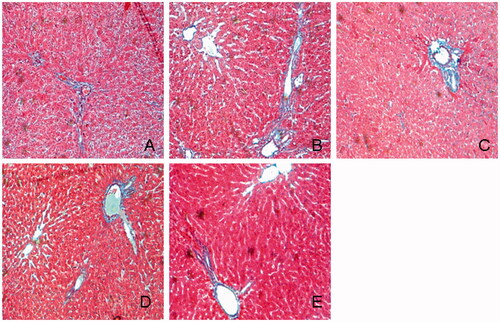
Figure 6. Immunostaining of ED-1 positive cell in the liver. (A) Normal; (B) control diabetic; (C) diabetic + TGP 50 mg/kg; (D) diabetic + TGP 100 mg/kg; (E) diabetic + TGP 200 mg/kg. Original magnification 100×.
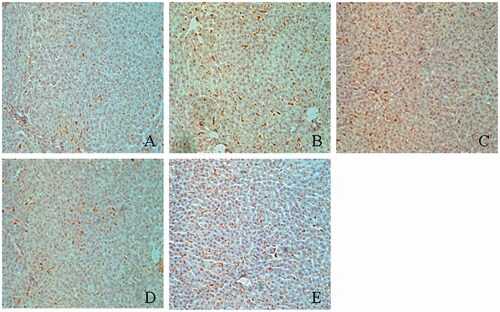
Figure 7. MCP-1 and TNF-α mRNA expression in the liver. Quantitative real time PCR analyse MCP-1 and TNF-α mRNA expression in the liver. **p < 0.01 vs. normal; #p < 0.05, vs. control diabetic.
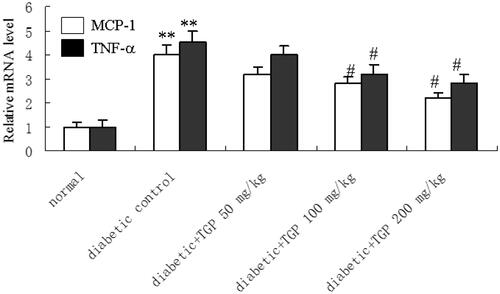
Figure 8. (a) Western blot analysis of MCP-1 in liver issue in five groups of rats. (1) Normal; (2) control diabetic; (3) diabetic + TGP 50 mg/kg; (4) diabetic + TGP 100 mg/kg; (5) diabetic + TGP 200 mg/kg. **p < 0.01 vs. normal; #p < 0.05, ##p < 0.01 vs. control diabetic. (b) Western blot analysis of TNF-α in liver issue in five groups of rats. (1) Normal; (2) control diabetic; (3) diabetic + TGP 50 mg/kg; (4) diabetic + TGP 100 mg/kg; (5) diabetic + TGP 200 mg/kg. **p < 0.01 vs. normal; #p < 0.05, ##p < 0.01 vs. control diabetic.
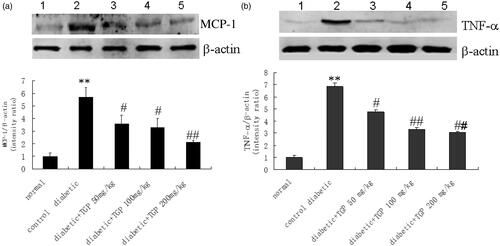
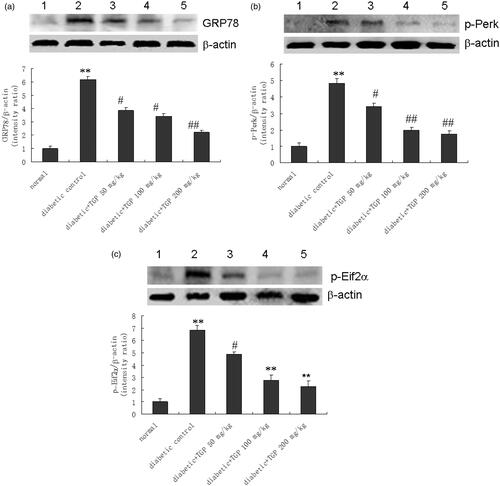
Figure 9. (a) Western blot analysis of GRP78 in liver issue in five groups of rats. (1) Normal; (2) control diabetic; (3) diabetic + TGP 50 mg/kg; (4) diabetic + TGP 100 mg/kg; (5) diabetic + TGP 200 mg/kg. **p < 0.01 vs. normal; #p < 0.05, ##p < 0.01 vs. control diabetic. (b) Western blot analysis of p-Perk in liver issue in five groups of rats. (1) Normal; (2) control diabetic; (3) diabetic + TGP 50 mg/kg; (4) diabetic + TGP 100 mg/kg; (5) diabetic + TGP 200 mg/kg. **p < 0.01 vs. normal; #p < 0.05, ##p < 0.01 vs. control diabetic. (c) Western blot analysis of p-Eif2α in liver issue in five groups of rats. (1) Normal; (2) control diabetic; (3) diabetic + TGP 50 mg/kg; (4) diabetic + TGP 100 mg/kg; (5) diabetic + TGP 200 mg/kg. **p < 0.01 vs. normal; #p < 0.05, ##p < 0.01 vs. control diabetic.