
Figures & data
Figure 1. Rate of apoptosis induced by different concentrations of paclitaxel.
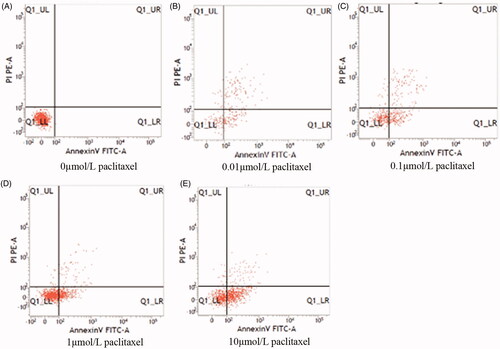
Figure 3. Results of immunohistochemical and western blot assays of NF-κB p65, IL-1β, TNFα and GABAB1 receptors in the five groups.
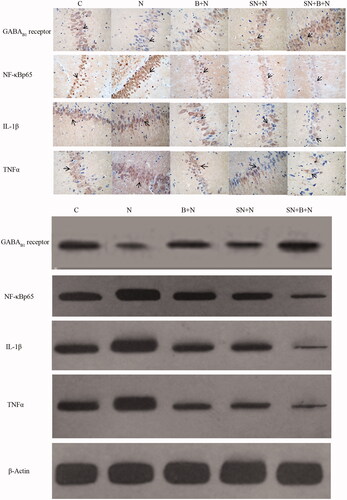
Table 1. Cell apoptosis induced by 24 h paclitaxel treatment (%, n = 4, ¯x ± s).
Figure 2. Apoptosis and protein levels of NF-κB p65 and GABAB1 receptors in the six groups.
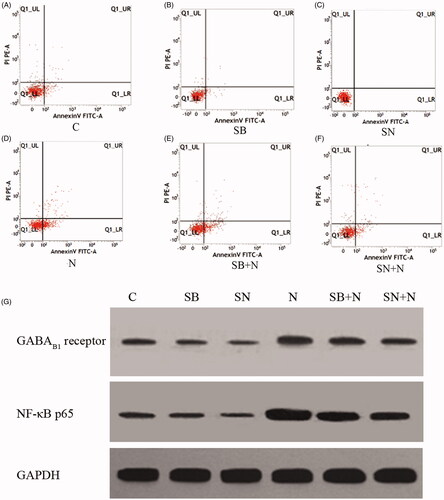
Table 2. Comparison among early apoptosis rate, and protein levels of GABAB1 receptor and NF-κB p65 in six groups (n = 5, ¯x ± s).
Table 3. The escape latency and the number of crossings over the platform location of rats in two groups (n = 15 ¯x ± s).
Table 4. The mechanical withdrawal threshold (MWT) values of rats in different groups at three time points (g, n = 10, ¯x ± s).
Table 5. The number of GABAB1 receptor, NF-κB p65, IL-1β and TNFα-positive cells determined by immunohistochemistry assay analysis and western blot results of proteins in five groups (n = 5, ¯x ± s).