Figures & data
Table 1. Primers used in this study.
Figure 1. The change of body weight before and after treatment. T2DM: type 2 diabetes mellitus; Met: Metformin; MC100: MCE 100 mg; MC200: MCE200 mg; MC400: MCE400 mg. *p < 0.05 and **p < 0.01 the T2DM group versus control and treated groups; ΔΔp < 0.01 the pretreatment control group versus the pretreatment T2DM groups.
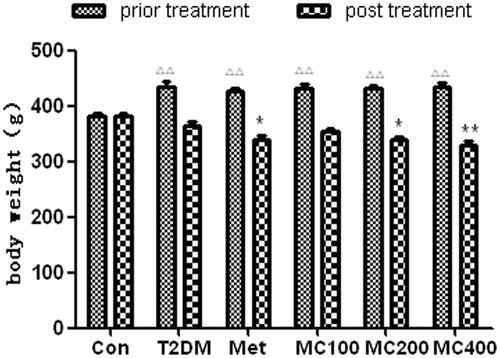
Figure 2. The change of fasting serum glucose, insulin, and HOMA-IR. After 8 weeks treatment, following an overnight fasting, rats were sacrificed and the serum was assay. (A) fasting serum glucose, (B) fasting serum insulin, (C) HOMA-IR; Con: control; T2DM: Type 2 diabetes mellitus; Met: Metformin; MC100: MCE 100 mg; MC200: MCE 200 mg; MC400: MCE400 mg. *p < 0.05 and **p < 0.01 the T2DM group versus control and treated groups.
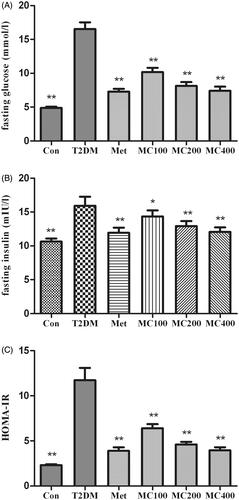
Figure 3. The change of liver glycogen. The result of liver glycogen PAS dyeing (×400), Con: control; T2DM: Type 2 diabetes mellitus; Met: Metformin; MC100: MCE 100 mg; MC200: MCE 200 mg; MC400: MCE 400 mg. *p < 0.05 and **p < 0.01 the T2DM group versus control and treated groups.
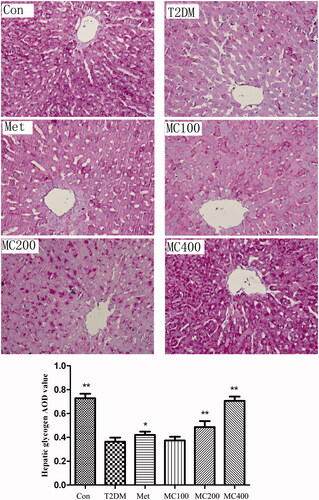
Figure 4. The change of serum inflammatory factors. Con: control; T2DM: type 2 diabetes mellitus; Met: Metformin; MC100: MCE 100 mg; MC200: MCE 200 mg; MC400: MCE 400 mg. *p < 0.05 and **p < 0.01 the T2DM group versus control and treated groups.
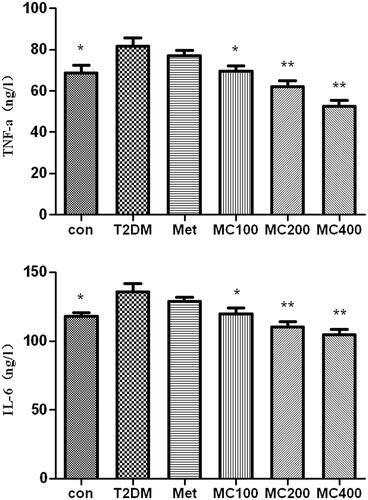
Figure 5. The mRNA expression level of insulin signal transduction pathway relative factors. After 8 weeks treatment, following an overnight fasting, rats were sacrificed and mRNA expression analysis of hepatic insulin regulating factors. Con: control; T2DM: Type 2 diabetes mellitus; Met: Metformin; MC100: MCE 100 mg, MC200: MCE 200 mg; MC400: MCE400 mg. Each value represents the mean ± SE, n = 3 rats. **p < 0.01, the T2DM group versus control and treated groups.
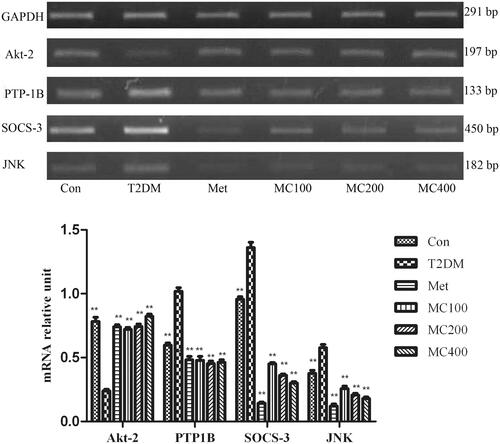
Figure 6. The protein level of GLUT-4 in skeletal muscle. Data are representative images for GLUT-4 level after 8 weeks treatment. The scanned bar graph shows the GLUT-4’ statistical change. Con: control; T2DM: Type 2 diabetes mellitus; Met: Metformin; MC100: MCE 100 mg; MC200: MCE 200 mg; MC400: MCE 400 mg. *p < 0.05 and **p < 0.01 the T2DM group versus control and treated groups.
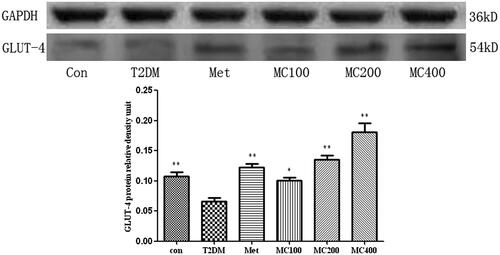
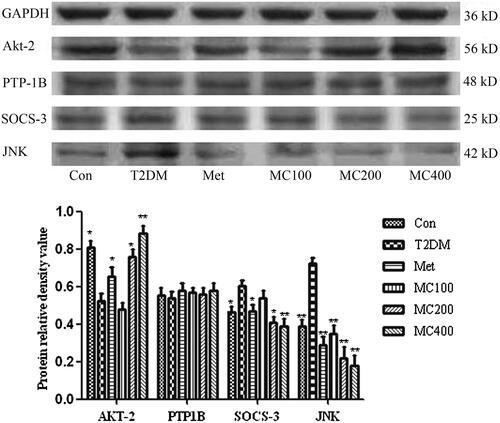
Figure 7. The protein level of insulin signal transduction pathway relative factors. Data are representative images for insulin regulating factors after 8 weeks treatment. The scanned bar graph shows the insulin regulating factors’ statistical change. Con: control; T2DM: type 2 diabetes mellitus; Met: Metformin; MC100: MCE 100 mg; MC200: MCE200 mg; MC400: MCE400 mg. Each value represents the mean ± SE, n = 3 rats. *p < 0.05 and **p < 0.01 the T2DM group versus control and treated groups.