
Figures & data
Figure 1. Chemical structures of isolated compounds from C. arborea.
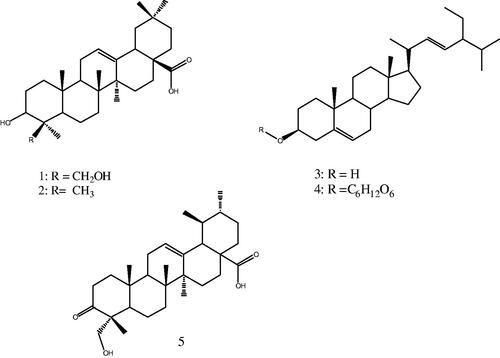
Table 1. 1H and 13 C NMR spectra data of Compound 1 (400 and 100 MHz, CD3OD) compared with 13 C NMR data of literature.
Table 2. 1H and 13 C NMR spectra data of Compound 2 (400 and 100 MHz, ppm in CDCl3) compared with 13 C NMR data of literature.
Table 3. 1H and 13 C NMR spectra data of Compound 3 (400 and 100 MHz, CDCl3) compared with 13 C NMR data of literature.
Table 4. 1H and 13 C NMR spectra data of Compound 4 spectra (400 and 100 MHz, C5D5N).
Table 5. 1H NMR data of Compound 5 (500 MHz, CDCl3) compared with 1H NMR data of literature.
Figure 2. The graph represents the effect of compounds 1–4 on oxidative burst. Compounds were tested on three different concentrations (1, 10 and 100 µg/mL). Results are presented in relative light units (RLU) and oxidative burst activity of whole blood using luminol as a probe. Each vertical bar represents a mean of triplicate. Error bars represent standard deviations of the means. Significance difference was calculated using one-way ANOVA and * represent p < 0.05 significance difference was compared to the + ve control. Where + ve = cells + zymosan and − ve = cells alone.
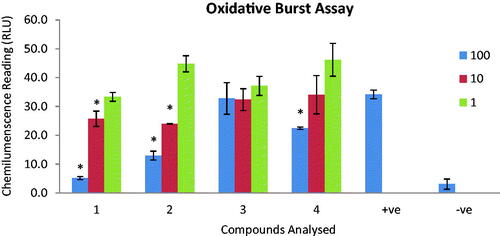
Figure 3. Effect of compounds on T-cell proliferation. Compounds were tested on three different concentrations (1, 10 and 100 µg/mL). Results are presented in counts per minutes (CPM). Each vertical bar represents a mean of triplicate. Error bars represent standard deviations of the means. Significance difference was calculated using one-way ANOVA. Significance difference was compared to the control having cells in the presence of PHA. Where * represent p < 0.05.
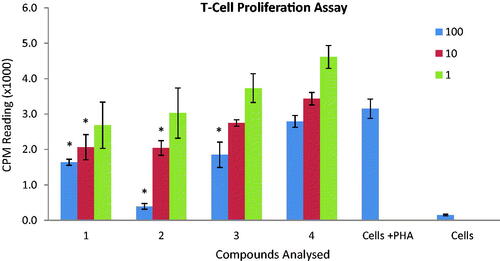
Table 6. Effect of pure compounds from C. arborea on phagocytes oxidative burst, T-cell proliferation and cytotoxicity on NIH-3T3 cells. The IC50 (µg / mL) was calculated using three doses (1, 10 and 100 µg/mL) of each compound. Values are expressed as mean ± SD of three determinations.