Figures & data
Figure 1. RP-HPLC of (a) the extract of C. longa and (b) curcumin.
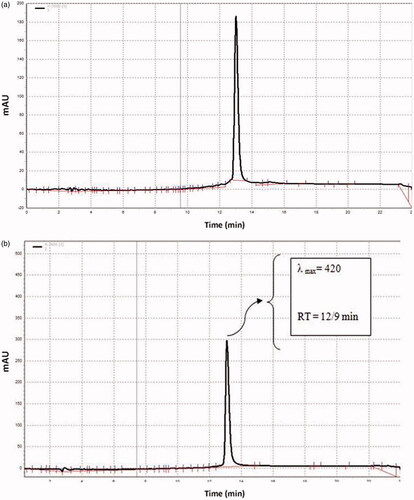
Figure 2. A diagram of the protocol of the study and the methods of evaluating of different mechanisms of the relaxant of effect of Curcuma longa the extract on tracheal smooth muscle.
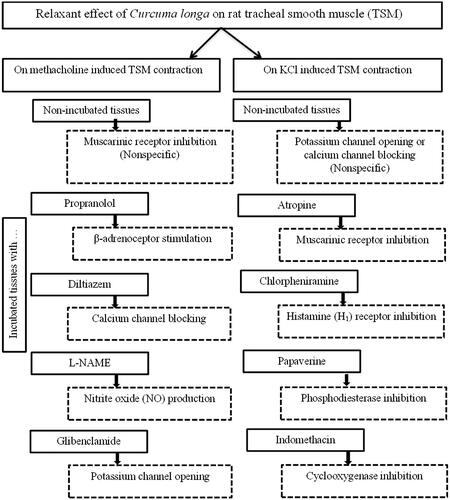
Figure 3. Concentration-response relaxant effect (mean ± SEM) of C. longa (n = 8) and theophylline (n = 6) on methacholine (10 μM) -induced contraction of rat tracheal smooth muscle in non-incubated tissues. ***: p < 0.001 compared to saline. +: p < 0.05 compared to the effect of theophylline. Statistical comparison was performed using ANOVA with Tukey Kramer post-test.
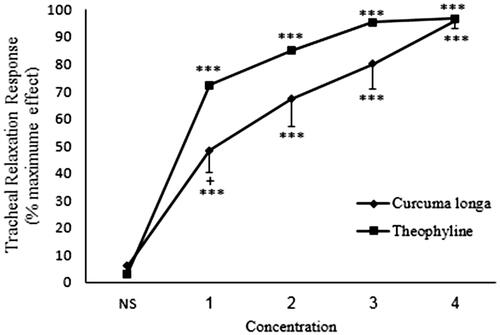
Table 1. Relationship between the relaxant effect of the extract of C. longa and theophylline with their concentrations in different experimental groups.
Figure 4. Concentration-response relaxant effect (mean ± SEM) of C. longa on methacholine (10 μM) -induced contraction of rat tracheal smooth muscle in non-incubated (n = 8) and incubated tissues with (a) propranolol (1 μM, n = 8), (b) diltiazem (5 μM, n = 8), (c) glibenclamide (1 μM, n = 7) and (d) L-NAME (300 μM, n = 7). ***: p < 0.001 compared to saline. There was no significant difference in the effect of the extract between non-incubated and incubated tissues with different agents. Statistical comparison was performed using ANOVA with Tukey Kramer post-test.
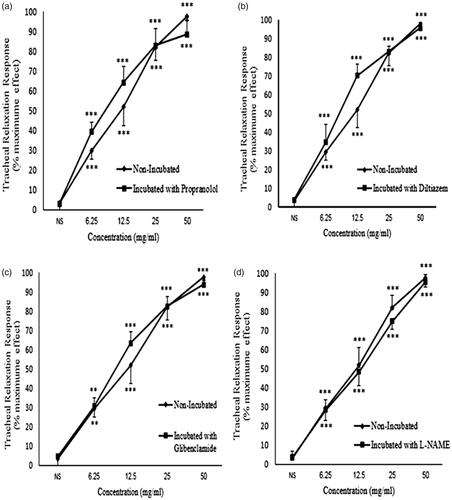
Table 2. Comparison of the relaxant effect of the extract of C. longa (percentage change in proportion to the maximum contraction) in different incubated tracheal smooth muscles contracted by 10 µM methacholine, (n = 9).
Figure 5. EC50 values of C. longa extract induce relaxation obtained on contracted tracheal smooth muscles of rat with (a) 10 μM methacholine, in non-incubated and incubated tissues with propranolol, diltiazem, L-NAME and glibenclamide (n = 8 for non-incubated and incubated tissues with propranolol and diltiazem, n = 7 for incubated tissues with L-NAME and glibenclamide) and (b) 60 mM KCl, in non-incubated and incubated tissues with atropine, chlorpheniramine, indomethacin and papaverine (n = 9 for non-incubated, n = 7 for incubated tissues with atropine and n = 8 for incubated tissues with chlorpheniramine, indomethacin and papaverine).There was no significant difference in EC50 values between non-incubated and incubated tissues with various agents. Statistical comparison was performed using ANOVA with Tukey Kramer post-test.
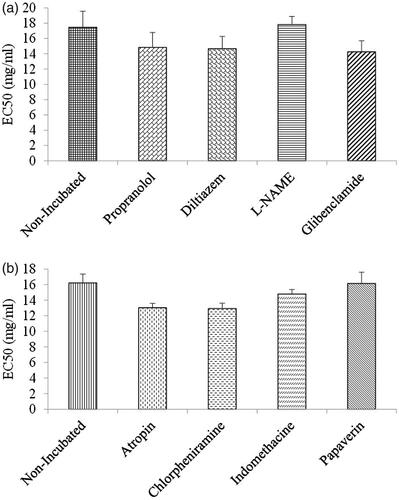
Figure 6. Concentration-response relaxant effect (mean ± SEM) of C. longa (n = 8) and theophylline (n = 6) on KCl (60 mM) -induced contraction of rat tracheal smooth muscle in non-incubated (n = 9) tissues. ***: p < 0.001 compared to saline. +++: p < 0.001, +: p < 0.05 compared to the effect of theophylline. Statistical comparison was performed using ANOVA with Tukey Kramer post-test.
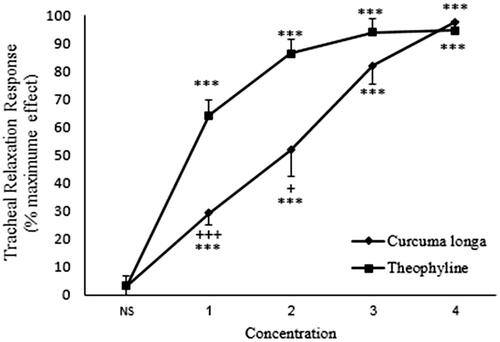
Figure 7. Concentration-response relaxant effect (mean ± SEM) of C. longa on KCl (60 mM) -induced contraction of rat tracheal smooth muscle in non-incubated (n = 9) and incubated tissues with (a) atropine (1 μM, n = 7), (b) chlorpheniramine (1 μM, n = 8), (c) indomethacin (1 μM, n = 8), (d) papaverine (100 μM, n = 8). ***: p < 0.001 compared to saline. There was no significant difference in the effect of the extract between non-incubated and incubated tissues. Statistical comparison was performed using ANOVA with Tukey Kramer post-test.
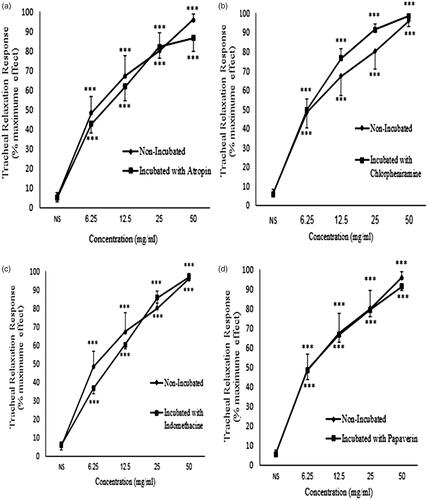
Table 3. Comparison of the relaxant effect of the extract of C. longa (percentage change in proportion to the maximum contraction) in different incubated tracheal smooth muscles contracted by 60 mM KCl, (n = 9).
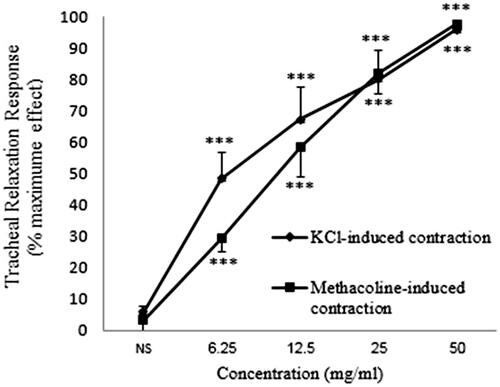
Figure 8. Concentration-response relaxant effect (mean ± SEM) of C. longa on KCl (60 mM) and methacholine (10 μM) -induced contraction of tracheal smooth muscle of rat in non-incubated tissues (n = 9 for each group). ***: p < 0.001 compared to saline. There was no significant difference in the relaxant effect of the extract between KCl and methacholine-induced contraction of tracheal smooth muscle. Statistical comparison of the effect of each concentration between two groups was performed using unpaired t-test.