
Figures & data
Table 1. 13C NMR data of compounds 1 and 2 in DMSO-d6 at 125 MHz.
Figure 1. Chemical structures of isolated compounds of Terminalia muelleri.
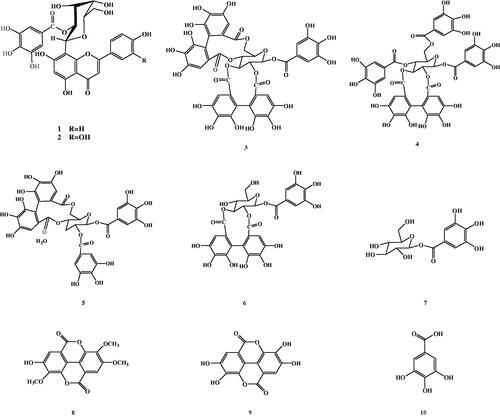
Figure 2. [GRAPHIC] HMBC correlations for 1 and 2. [GRAPHIC] Cosy correlations for H-2″ and H-1″ & 3″.
![Figure 2. [GRAPHIC] HMBC correlations for 1 and 2. [GRAPHIC] Cosy correlations for H-2″ and H-1″ & 3″.](/cms/asset/c763744b-2aff-47fa-a391-ba2f667e7c51/iphb_a_1406531_f0002_c.jpg)
Table 2. DPPH radical scavenging activity of the total extract and the isolated compounds.
Figure 3. The correlations between different concentrations of the total extract of T. muelleri and the surviving fraction of MCF-7 and PC3 cancer cells.
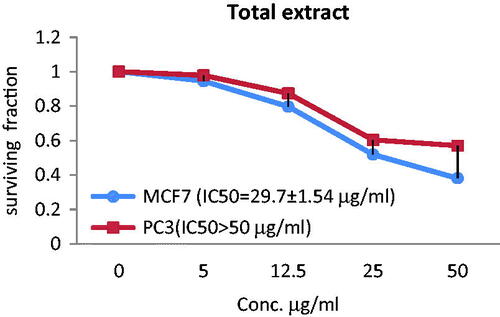
Figure 4. The correlations between different concentrations of compound 1 of T. muelleri and the surviving fraction of MCF-7 and PC3 cancer cells.
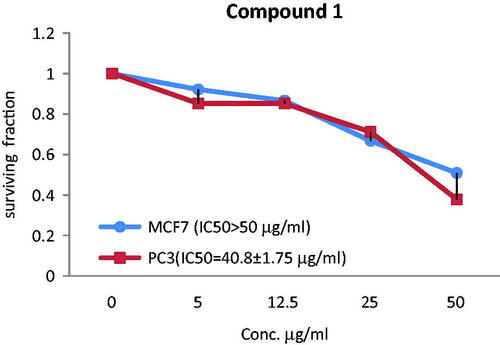
Figure 5. The correlations between different concentrations of compound 1 of T. muelleri and the surviving fraction of MCF-7 and PC3 cancer cells.
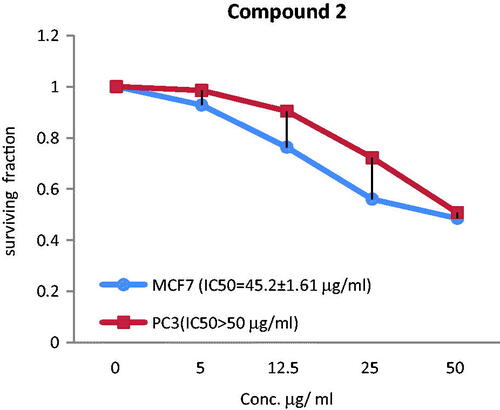
Figure 6. Ligand interaction representation of compounds 1 and 2 of T. muelleri with human topo I–DNA complex.
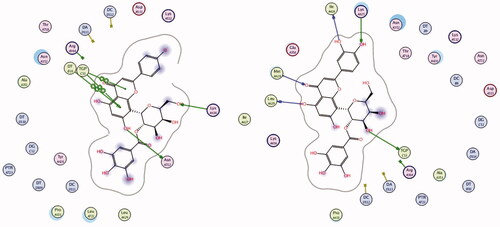
Figure 7. Ligand interaction representation (left) of camptothecin with human topo I–DNA complex and the corresponding 3D form (right).
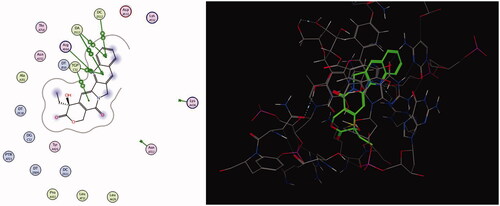
Figure 8. 3D representation of compounds 1 and 2 of T. muelleri with human topo I–DNA complex.
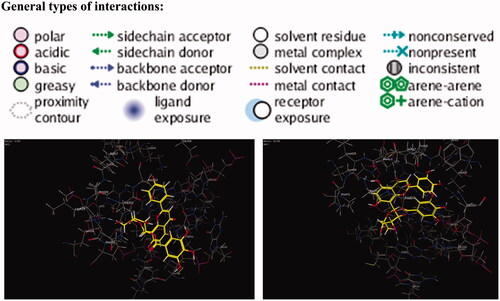
Table 3. Binding scores and amino acid interactions of the docked compounds on the active site of human DNA topoisomerase I enzyme (PDB: 1T8I).