Figures & data
Figure 1. HPLC profile of SBTE. Identification of compounds was done on the basis of the retention time, co-injections and spectral matching with standard.
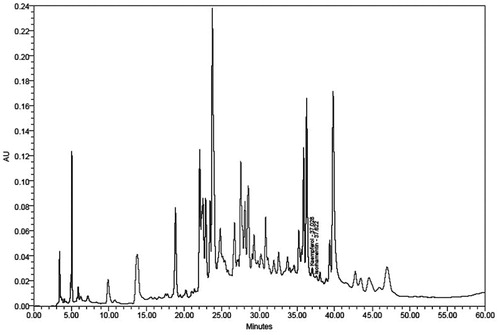
Figure 2. Hemolytic activity of SBTE. Hemolytic activity of different concentrations of SBTE (1000–7.8 mg/L) was measured in blood samples collected from healthy volunteers (n = 4). The graph represents the mean values of % hemolysis ± SD. Saline was used as negative control which shows minimum hemolysis and double distilled water (DDW) was used as positive control showing maximum hemolysis. One-way ANOVA Dunett’s T3 test was applied to calculate significance between the hemolytic activity of different concentrations of SBTE and positive control. p value <0.05 was considered as significant.
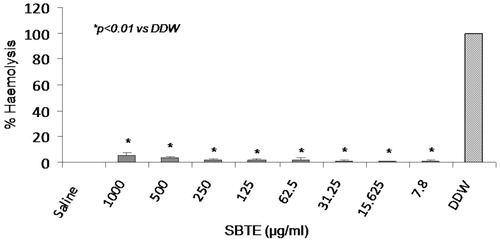
Figure 3. Rabies virus neutralizing antibody titers in mice sera. Sera samples were collected on (A) day 0 (pre-immunization); (B) days 7 and 14 (pooled); (C) days 21 and 28 (pooled); (D) day 35. PBS: mice immunized with PBS (n = 10); SBTE + Rb: mice immunized with SBTE + Rb antigen (n = 20); Al + Rb: mice immunized with algel + rabies antigen (n = 20). Experiments were done thrice. Booster was administered on day 14. Horizontal lines indicate the median values. Non-parametric Wilcoxon’s signed ranks test was applied for comparing different groups. p < 0.05 was considered to be significant; ns = not significant. Protective neutralization antibody titer limit was considered >0.5 IU/mL. Mice immunized with Rb antigen alone (n = 4) showed no protective RVNA titers (data not shown).
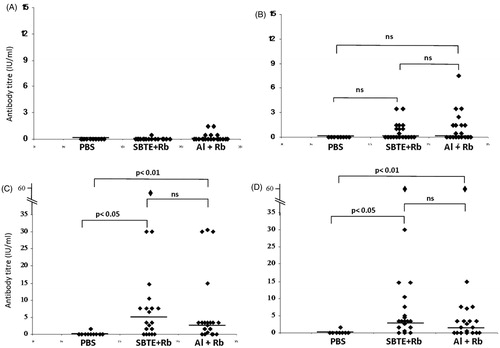
Figure 4. RVNA titers in mice sera from SBTE + Al + Rb immunized mice. Sera samples from immunized mice (n = 10) collected on (A) day 0 (pre-immunization); (B) days 7 and 14 (pooled); (C) days 21 and 28 (pooled); (D) day 35. Horizontal lines indicate the median values. Non-parametric Wilcoxon’s signed ranks test was applied for comparing antibody titers of pre-immunized group with post-immunized group. p < 0.05 was considered to be significant.
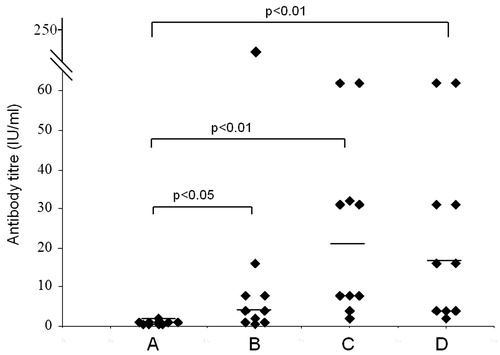
Figure 5. RVNA titers in mice sera from isorhamnetin + Rb immunized mice. Sera samples from immunized mice (n = 4) collected on (A) day 0 (pre-immunization); (B) days 7 and 14 (pooled); (C) days 21 and 28 (pooled). Horizontal lines indicate the median values. Mice immunized with Rb antigen alone (n = 4) showed no protective RVNA titers (data not shown).
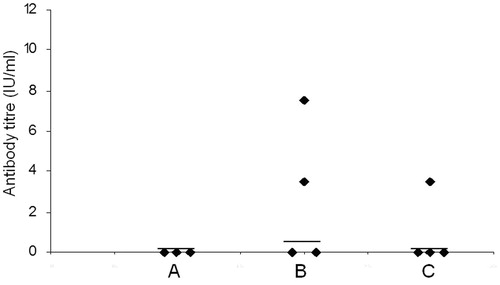
Figure 6. CTL response by SBTE. Bar graph showing the mean ± SEM (n = 3) of % CD8+ Gr B+ cell population in gated peripheral blood lymphocytes of different groups immunized with Rb antigen, SBTE + Rb antigen and algel + Rb antigen. Independent-samples t-test was applied for calculating significance between the immunized groups. *p value <0.05 vs. Rb.
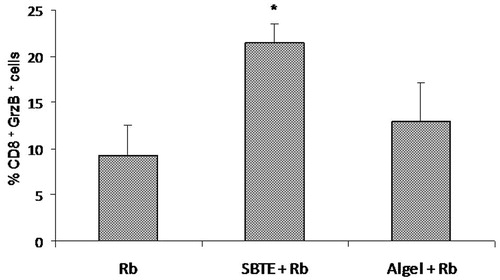
Table 1. Percent memory T cells, plasma cells and DCs in SBTE + Rb immunized mice.
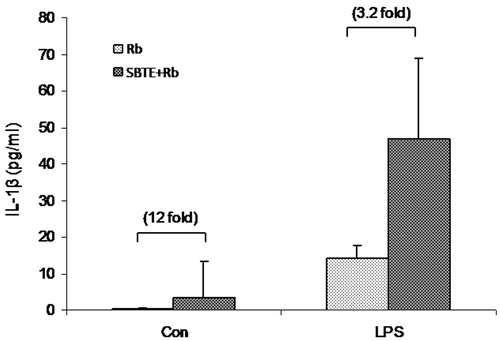
Figure 7. IL-1β production by peritoneal lavage cells in response to SBTE. Peritoneal cells were isolated from different groups of immunized mice (n = 3) as indicated: Rb: rabies antigen immunized; SBTE + Rb: SBTE + Rb antigen immunized and were cultured with or without LPS. Cells supernatants after 48 h were assayed for IL-1β. Values in bracket indicate the fold increase IL-1β production in comparison to the Rb antigen immunized group.