
Figures & data
Figure 1. Testosterone levels of all groups in the male rat. *Significant differences vs. control group (**p < 0.01, ***p < 0.001). #Significant differences vs. FA group (###p < 0.001). Data are expressed as mean ± SD. RD: Rosa damascena; FA: formaldehyde.
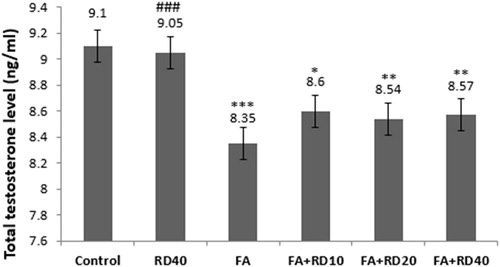
Table 1. Testis weight, testis volume, testis length and testis width in different groups (mean ± SD, n = 8).
Figure 2. Histological examinations of tubules in the testis of (A) control, (B) sham (RD40), (C) FA, (D) RD10 + FA, (E) RD20 + FA and (F) RD40 + FA groups. Abnormal and barren testicular seminiferous without spermatozoa were observed in germinal epithelium of FA group. In FA and RD + FA groups, the diameters of testicular seminiferous and epithelial tubules significantly decreased compared to the control group. However, in the ‘FA + RD’ groups, the diameters of seminiferous and epithelial tubules increased compared to the FA group. Scale bar =100 µm.
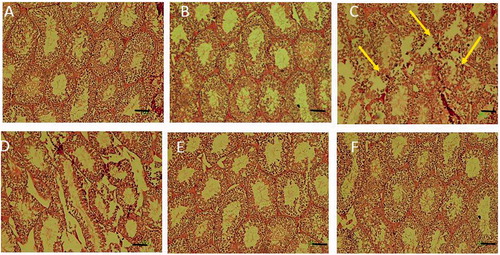
Table 2. Number of Leydig cell, diameters and thickness of seminiferous tubules in different groups (mean ± SD, n = 8).
Figure 3. Different types of sperm shape abnormality in FA group vs. control group. Sperm suspension was smeared onto glass slides and stained using the method of Papanicolaou. Spermatozoa were counted and categorized as normal, head abnormal, neck abnormal and tail abnormal spermatozoa, ×100 magnification.
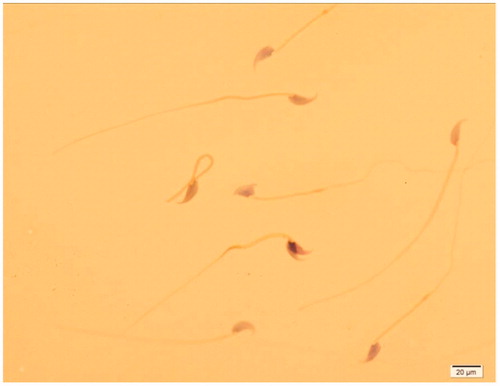
Table 3. Sperm number, sperm motility, sperm viability and rate of normal sperm of all groups (mean ± SD, n = 8).