
Figures & data
Table 1. 1 H NMR (400 MHz) and 13 C NMR (100 MHz) data of 1 in CDCl3.
Figure 1. Chemical structures of compounds 1–12.
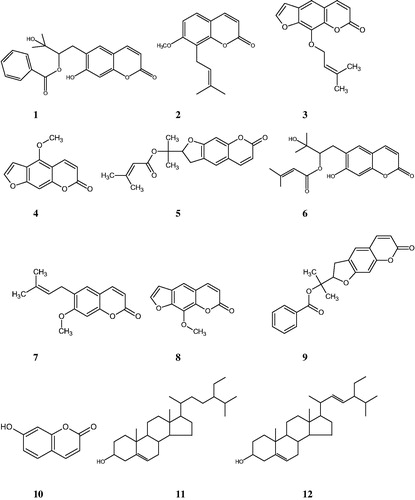
Figure 2. Significant HMBC (→) correlations of compound 1.
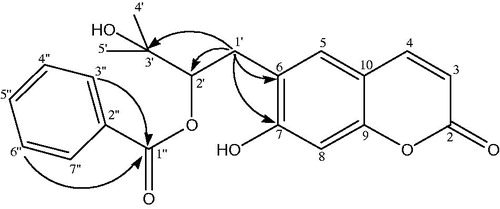
Figure 3. α-Glucosidase inhibition (%) of extracts and fractions of roots from Ferulago bracteata at different concentrations. The different extracts and fractions were compared with acarbose and p < 0.05 (p = 0.0004).
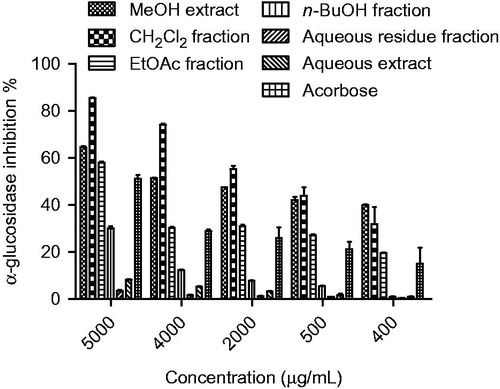
Figure 4. α-Glucosidase inhibition effects (%) of compounds 1–10. The isolated coumarins were compared with acarbose and p <0.05 (p = 0.0437).
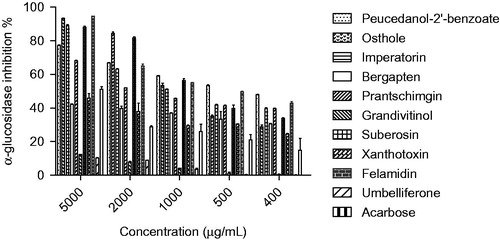
Table 2. α-Glucosidase inhibitory activities of extracts, fractions and compounds 1–10.