
Figures & data
Figure 1. Effects of ST and STC on bleeding time. Data are shown as mean ± SD from six independent experiments (n = 6). #p < 0.05, ##p < 0.01 vs. control group. *p < 0.05, **p < 0.01 vs. model group.
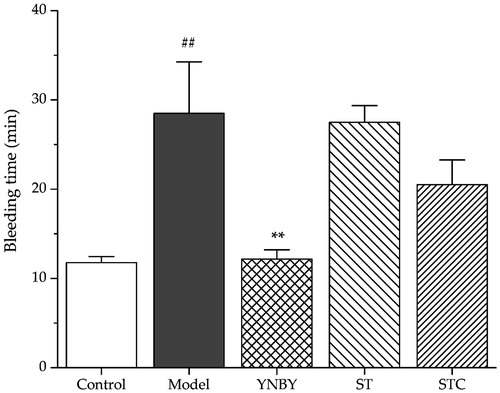
Table 1. Effects of ST and STC on WBV and plasma viscosity at various shear rates (n = 6).
Figure 2. Effects of ST and STC on (A) erythrocyte sedimentation rate blood an d (B) packed cell volume . Data are shown as mean ± SD from six independent experiments (n = 6). #p < 0.05, ##p < 0.01 vs. control group. *p < 0.05, **p < 0.01 vs. model group.
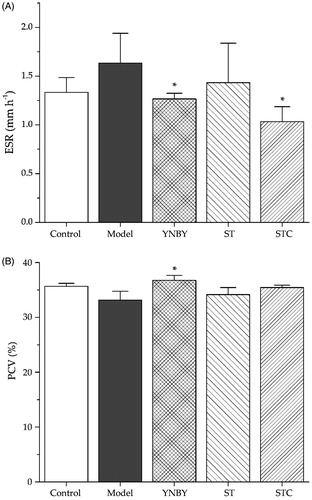
Table 2. Effects of ST and STC on plasma coagulation parameters (n = 6).
Figure 3. The representative HPLC-DAD chromatograms of (a) ST and (b) STC.
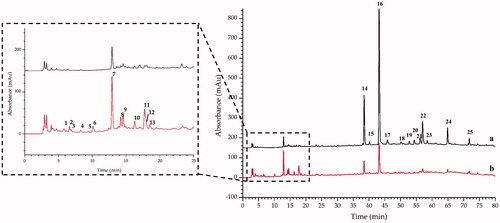
Table 3. Peak area of each common peak and their difference according to the percentage of the peak area (n = 3).
Figure 4. Total ion chromatograms of STC in (A) positive mode and (B) negative mode.
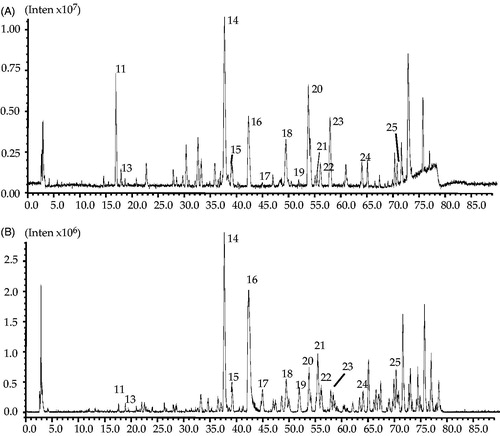
Table 4. Identification of constituents in ST and STC by HPLC–IT-TOF–MS in positive and negative ion mode.
Figure 5. Effects of dihydrocaffeic acid on New Zealand rabbit platelet aggregation induced by collagen and trap-6. Data are expressed as mean ± SD of six measurements (n = 6). **p < 0.01 as compared to control group; *p < 0.05 as compared to control group.
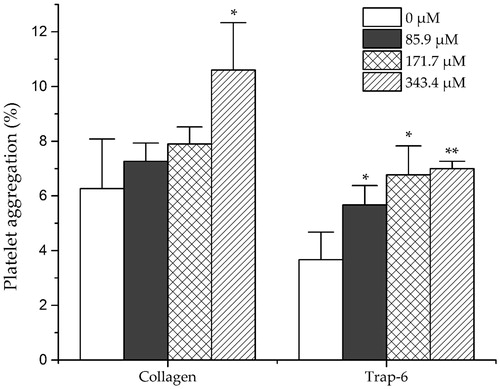
Figure 6. Effects of amentoflavone on New Zealand rabbit platelet aggregation induced by THR, ADP and AA. Data are expressed as mean ± SD of six measurements (n = 6). **p < 0.01 as compared to control group; *p < 0.05 as compared to control group.
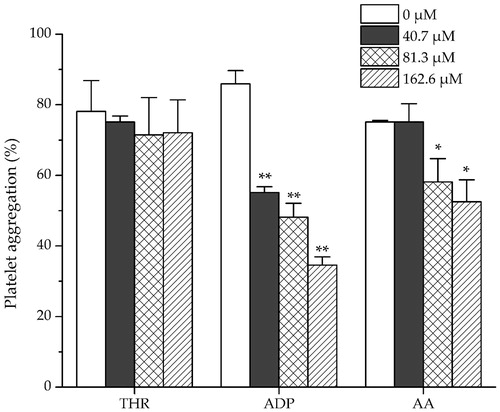
Table 5. Effects of dihydrocaffeic acid on New Zealand rabbit platelet plasma TT, APTT, PT (INR) (n = 6).