Figures & data
Figure 1. An overview of the experimental design.
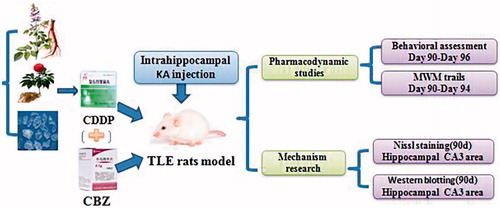
Figure 2. Effects of CDDP and its combination with CBZ on the degree of seizure. (A) Seizure severity score. (B) Frequency of SRS. SRS in each group were recorded three times a day for 1 week, only the seizures of stage 3 or greater according to Racine stages were recorded. The results are presented as mean ± SEM. *p < 0.05 versus the model group (n = 14 per group).
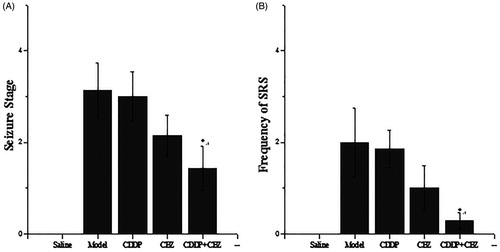
Figure 3. Effect of CDDP and its combination with CBZ on cognitive impairment in the MWM place navigation test. Average escape latencies to find the hidden platform for each trial day are presented as means ± SEM (n = 6 per group).
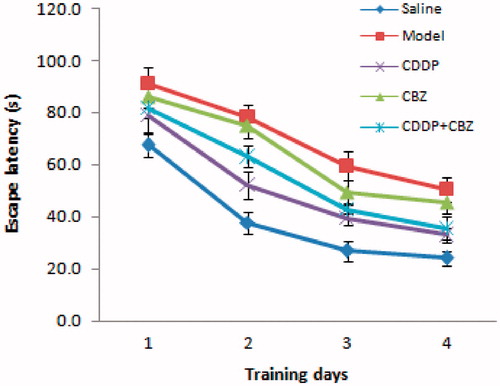
Figure 4. Effect of CDDP and its combination with CBZ on cognitive impairment in the MWM probe trial. (A) Frequency of platform crossing. (B) Time spent in the target quadrant (%). Results are presented as means ± SEM. △p < 0.05, △△p < 0.01 versus the control group; *p < 0.05, **p < 0.01 versus the model group; ▲p < 0.05 versus the CBZ group (n = 6 per group).
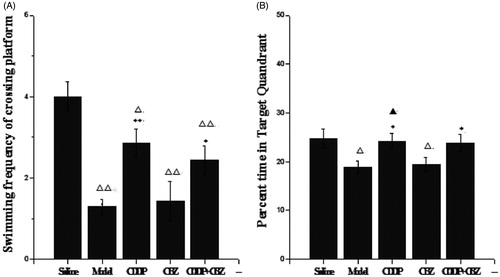
Table 1. Average escape latencies to find the hidden platform for each trial day in the MWM test.
Figure 5. Effect of CDDP and its combination with CBZ on KA-induced neuron death (A) Nissl staining was used to assess the neuronal damage of hippocampus (magnification ×50). The arrowheads show the position of the hippocampal CA3 area. (B) The neuronal loss in the hippocampal CA3 region (magnification ×200). (C) The number of surviving neurons in the hippocampal CA3 region was counted. The results are presented as means ± SEM. △△p < 0.01 versus the control group; **p < 0.01 versus the model group; ▽▽p < 0.01 versus the CDDP group; ▲p < 0.05 versus the CBZ group (n = 6 per group). Scale bars: 100 μm.
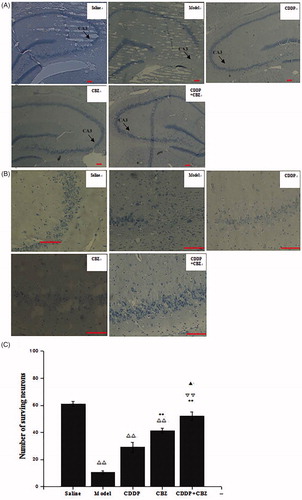
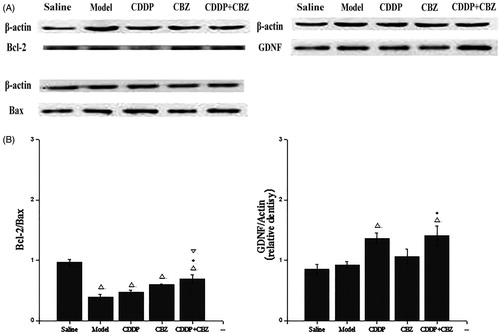
Figure 6. Effect of CDDP and its combination with CBZ on the expression of GDNF and Bcl-2/Bax in the hippocampal CA3 region. (A) Western blotting was used to evaluate protein expression of GDNF, Bcl-2 and Bax, and β-actin was used as an internal control. (B) Densitometry analysis was performed using Bio-Rad Quantity One software. The relative band density of GDNF and Bcl-2/Bax are shown in the bar diagram. The results are presented as means ± SEM. △p < 0.05 versus the control group; *p < 0.05 versus the model group; ▽p < 0.05 versus the CDDP group (n = 6 per group).