
Figures & data
Figure 1. Clinical chemistry: the value of creatinine (CREA) and blood urea nitrogen (BUN) (n = 8). #Compared with HCG (p < 0.01).
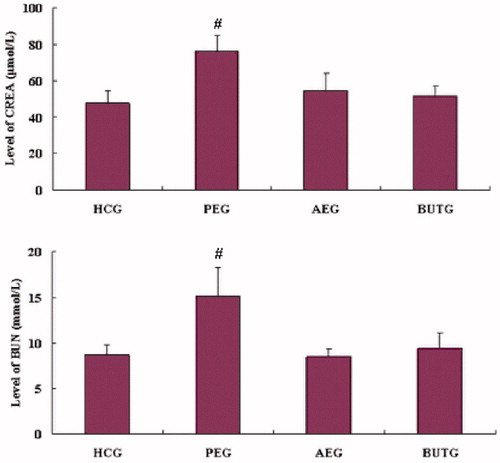
Figure 2. Histopathological photomicrographs of rat kidney sections (40×).
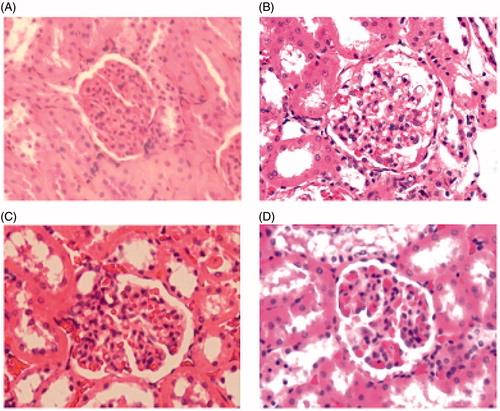
Figure 3. PCA score plot (A) and corresponding loading plot (B) of kidney samples in the time-point of 10th week post-dose for rats administrated with PE section of EPR. (□) HCG and (△) PEG.
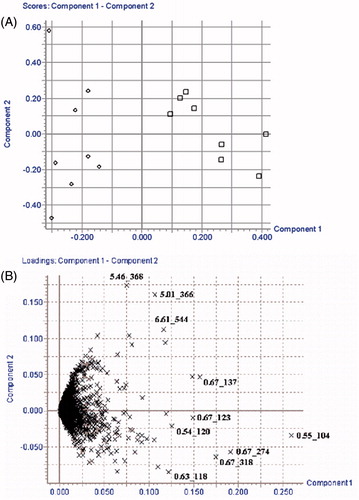
Figure 4. The comparison of biomarker intensity between HCG and PEG. (A) Hypoxanthine, (B) LPC C 20:4, (C) niacinamide, (D) phenylalanine, (E) C16 dihydrosphingosine, (F) C18 phytosphingosine, (G) N,N-dimethylglycine, (H) unknown, (I) unknown and (J) unknown. #Compared with HCG (p < 0.05) and *compared with HCG (p < 0.01).
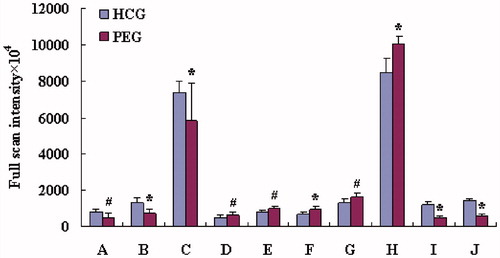
Table 1. Potential kidney biomarkers of nephrotoxicity induced by EPR.
Figure 5. A set of chromatograms of (A) petroleum ether extract of EPR in positive ion mode, (B) petroleum ether extract of EPR in negative ion mode, (C) blank rat serum in positive ion mode, (D) blank rat serum in negative ion mode, (E) 1 h rat serum sample after oral administration of petroleum ether extract of EPR in positive ion mode and (F) 1 h rat serum sample after oral administration of petroleum ether section of EPR in negative ion mode.
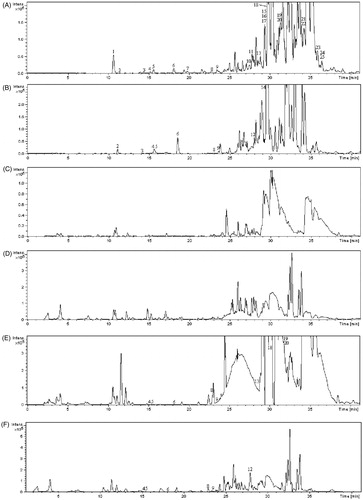
Figure 6. Product ion scan spectra in negative ion mode under different collision energies (10, 20 and 25 eV) and possible MS fragmentation mechanism of (–)-(1S)-15-hydroxy-18-carboxycembrene.
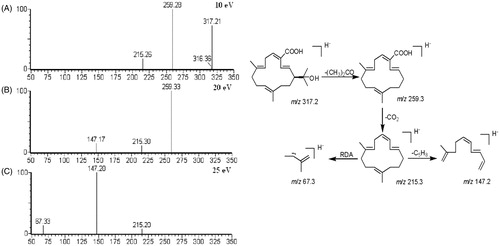
Figure 7. Chemical structures of compounds identified from PE section.
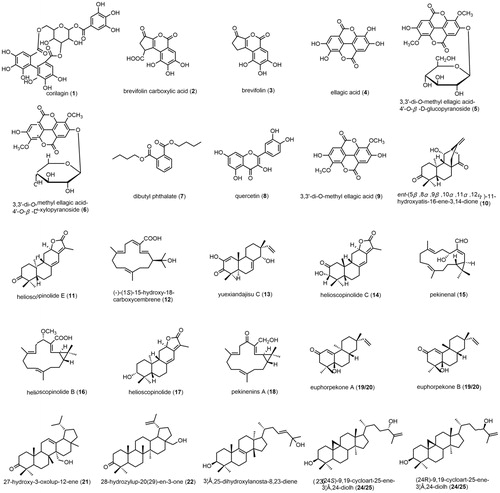
Table 2. MS data (m/z) of the compounds of PE section of EPR and in rat serum after oral administration of PE section of EPR.