Figures & data
Figure 1. The chemical structure of geniposide.
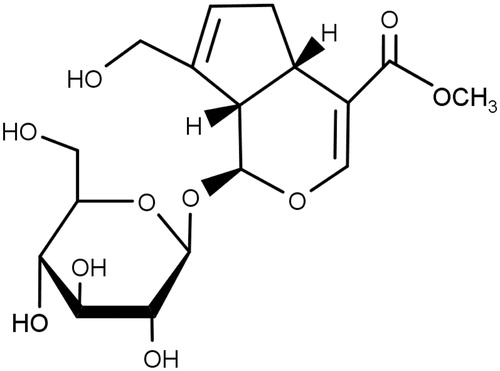
Figure 2. Attenuating effects of geniposide on the reactive oxygen species (ROS) elevation in human dermal fibroblasts under UV-B irradiation. Fibroblasts were subjected to the varying concentrations (0, 5, 12 or 30 μM) of geniposide for 30 min before the irradiation. The intracellular ROS levels were determined using DCFH-DA (A), DHE (B) and DHR-123 (C) in a microplate fluorometer. The intracellular ROS level was represented as DCF (A), 2-hydroethidium (2-HE, B) and rhodamine 123 (RH-123, C) fluorescence, expressed as % of the non-irradiated control. *p < 0.05; **p < 0.01; ***p < 0.001 versus the non-treated control (UV-B irradiation alone).
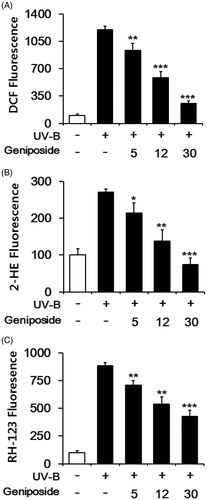
Figure 3. Effects of geniposide on cellular viability in human dermal fibroblasts under UV-B irradiation. The viable cell numbers, represented as % of the non-irradiated control, were determined using the MTT assay.
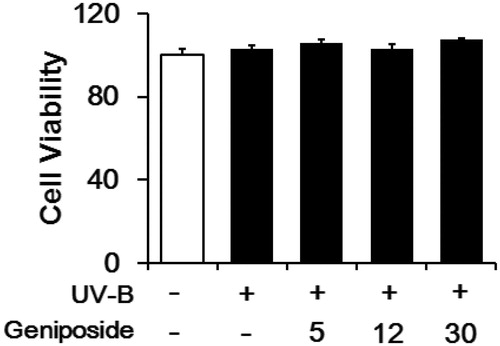
Figure 4. Attenuating effect of geniposide on the elevation of promatrix metalloproteinase-2 (proMMP-2) activity (A) and protein (B) levels in human dermal fibroblasts under UV-B irradiation. Fibroblasts were subjected to the varying concentrations (0, 5, 12 or 30 μM) of geniposide for 30 min before the irradiation. (A) The proMMP-2 gelatinolytic activity in conditioned medium was detected using gelatin zymography. (B) The proMMP-2 proteins in cellular lysates were determined using western blotting analysis with anti-MMP-2 antibodies. GAPDH was used as an internal loading control. A representative of the three independent results was shown. The band strength, represented as % of the non-irradiated control, was determined by densitometry using the ImageJ (version 1.48) software which is downloaded from the NIH website. (B) It was normalized to the corresponding GAPDH band. #p < 0.05 versus the non-irradiated control. (UV-B irradiation alone). *p < 0.05; **p < 0.01; ***p < 0.001.
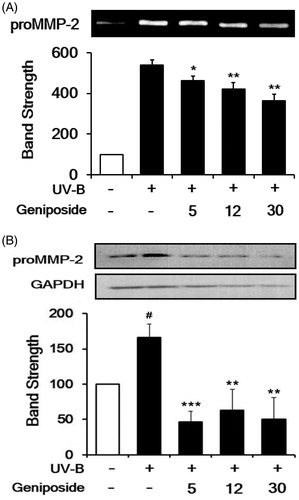
Figure 5. Enhancing effects of geniposide on total glutathione (GSH) levels in cellular lysates of human dermal fibroblasts under the irradiation with UV-B radiation. Fibroblasts were subjected to the varying concentrations (0, 5, 12 or 30 μM) of geniposide for 30 min before the irradiation. Total GSH content, expressed as μg/mg protein, was determined with enzymatic recycling assay using GR. ###p < 0.001 versus the non-irradiated control. ***p < 0.001 versus the non-treated control (UV-B irradiation alone).
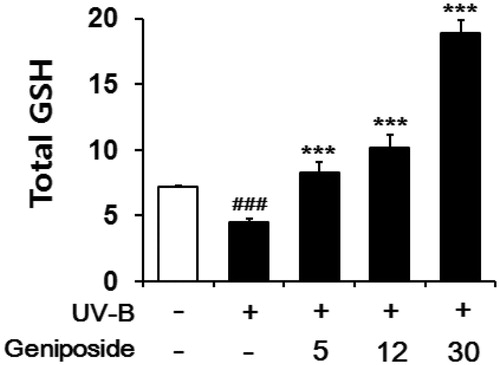
Figure 6. Enhancing effects of geniposide on total superoxide dismutase (SOD) activity levels in cellular lysates of human dermal fibroblasts under the irradiation with UV-B radiation. Fibroblasts were subjected to the varying concentrations (0, 5, 12 or 30 μM) of geniposide for 30 min before the irradiation. Total SOD activity, expressed as Δ550/min/mg protein, was measured using a spectrophotometric assay. ##p < 0.01 versus the non-irradiated control. ***p < 0.001 versus the non-treated control (UV-B irradiation alone).
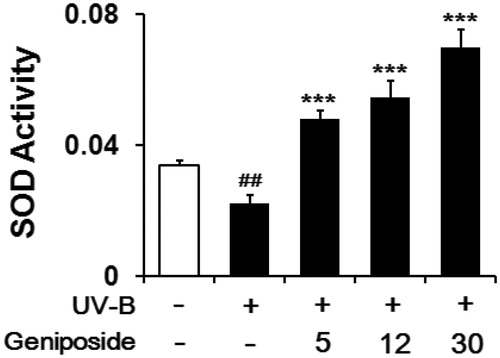
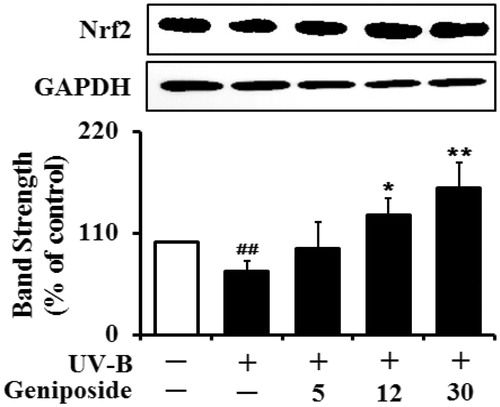
Figure 7. Enhancing effect of geniposide on the Nrf2 levels in human dermal fibroblasts under UV-B irradiation. Fibroblasts were subjected to fresh media with the varying concentrations (0, 5, 12 or 30 μM) of geniposide for 30 min before the irradiation. The Nrf2 proteins were determined using western blotting analysis with anti-Nrf2 antibodies. GAPDH was used as a protein loading control. The relative band strength was determined with densitometry using ImageJ software. Data are presented as % of control versus the non-irradiated control. ##p < 0.01 versus the non-irradiated control; *p < 0.05; **p < 0.01 versus the non-treated control (UV-B irradiation alone).