Figures & data
Table 1. Primers used for qPCR.
Figure 1. Chemical structure of cudraflavanone A (A), and effect of this compound on BV2 cell viability (B). Cells were treated with cudraflavanone A at the indicated concentrations for 24 h, and cell viability was determined by MTT assay. ***p < 0.001 in comparison with control.
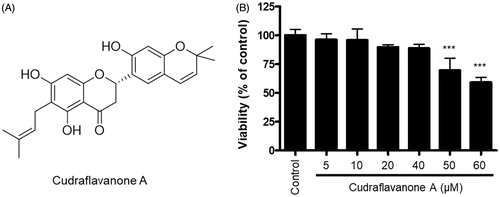
Figure 2. Effects of cudraflavanone A on LPS-induced NO, PGE2 production, iNOS, COX-2 protein expression and COX-2 enzyme activity in BV2 cells. (A–C) Cells were pretreated with/without the indicated concentrations of cudraflavanone A for 3 h and then stimulated with LPS (1 µg/mL) for 24 h. Nitrite levels (A) were determined using the Griess reaction and PGE2 (B) was quantified by ELISA. *p < 0.05, **p < 0.01, and ***p < 0.001 in comparison with LPS-treated group. (C) iNOS and COX-2 protein expression was determined by Western blot analysis. Representative blots from three independent experiments are shown. (D) COX-2 enzyme was treated with the indicated concentrations of cudraflavanone A for 5 min. DuP-697 was used as positive COX-2 inhibitor controls. ***p < 0.001 in comparison with COX-2 enzyme treated group. Values shown are means ± SD of three independent experiments.
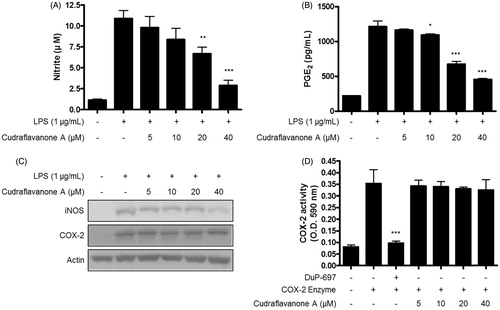
Figure 3. Effects of cudraflavanone A on IL-1β (A, D), IL-6 (B, E) and TNF-α (C, F) in LPS-stimulated BV2 cells. Cells were pretreated with/without the indicated concentrations of cudraflavanone A for 3 h and then stimulated with LPS (1 μg/mL) for 24 h (A–C) and 6 h (D–F), respectively. The concentration of cytokines was measured by ELISA, and mRNA expression was analysed by qPCR. *p < 0.005, **p < 0.01 and ***p < 0.001 in comparison with LPS-treated group.
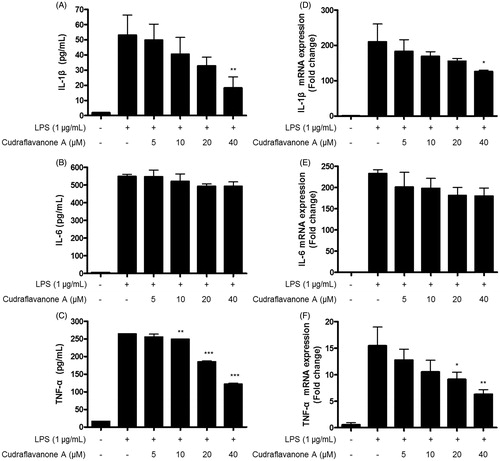
Figure 4. Effect of cudraflavanone A on LPS-induced activation of NF-κB in BV2 cells. Cells were pretreated with the indicated concentrations of cudraflavanone A for 3 h and then stimulated with LPS (1 μg/mL) for 1 h. Nuclear and cytosolic extracts were isolated and the levels of p65 and p50 in the nuclear fraction, and p-IκB-α and IκB-α in the cytosolic fraction were determined by Western blot analysis. PCNA and actin were used as internal controls. The experiment was repeated three times, and similar results were obtained.
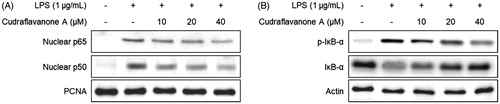
Figure 5. Effects of cudraflavanone A on LPS-induced activation of MAPK pathways in BV2 cells. Lysates were prepared from cells pretreated with/without the indicated concentrations of cudraflavanone A for 3 h and then with LPS (1 μg/mL) for 30 min. The phosphorylated and total forms of p38, ERK and JNK were determined by Western blot analysis. Actin was used as internal controls. The experiment was repeated three times, and similar results were obtained.
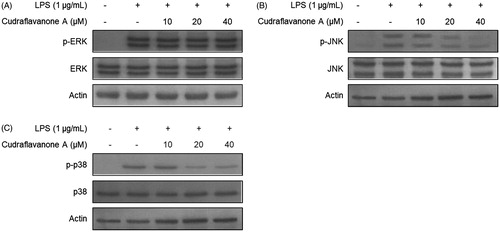
Figure 6. Effects of cudraflavanone A on the HO-1 expression (A), Nrf2 nuclear translocation (B) and Nrf2 DNA binding activity (C) in BV2 cells. (A) Cells were treated with cudraflavanone A for 12 h at various concentrations and Western blot analysis for HO-1 expression was performed. The HO-1 inducer CoPP, was used as a positive control. (B) Cells were treated with 40 μM cudraflavanone A for 0.5, 1 and 1.5 h, and the levels of Nrf2 protein in each fraction were determined by Western blot analysis. (C) Cells were treated with 40 μM cudraflavanone A for 0.5, 1 and 1.5 h. The degree of Nrf2 DNA binding activity was determined by ELISA kit. **p < 0.01 in comparison with 0 h treated group. The experiments were repeated three times and similar results were obtained.
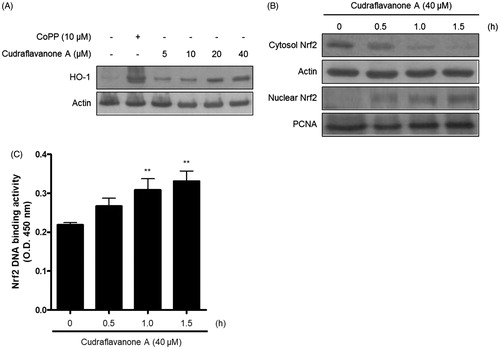
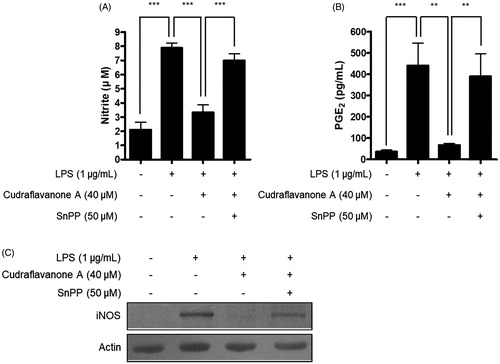
Figure 7. Effects of SnPP on the inhibitory actions of cudraflavanone A on the NO, PGE production and iNOS protein expression. Cells were pretreated with 50 μM of SnPP and incubated with or without cudraflavanone A (40 μM) for 24 h. (A) Nitrite levels were determined using the Griess reaction and (B) PGE2 was quantified by ELISA. **p < 0.01 and ***p < 0.001. (C) iNOS protein expression was determined by Western blot analysis, and representative blots from three independent experiments are shown.