Figures & data
Figure 1. The effects of crocin treatment (10, 20 and 40 mg/kg/days) on arthritis score (A), paw swelling (B) and weight loss (C) in collagen-induced arthritis (CIA) rats. The arthritis score (A) and body weight (C) in each treatment group was determined daily. Paw swelling (B) was measured daily using microcallipers, and the mean width of the first hind paw in which arthritis developed in each treatment group was determined. Day 0 in the figure is day 28 after initial immunization. Norm: normal rats; Cont: control CIA rats. Data are presented as the mean ± SE (n = 15). *p < 0.05, **p < 0.01, compared with the Cont.
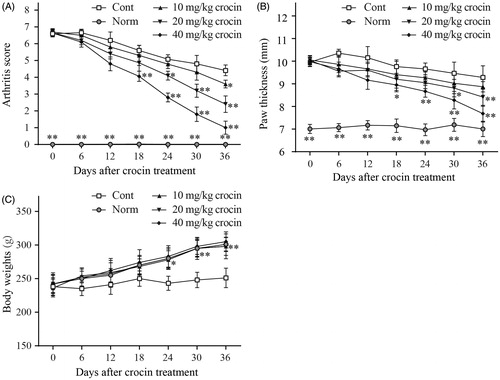
Figure 2. The effects of crocin treatment on joint inflammation, bone erosion and cartilage destruction in CIA rats. The ankle joints were subjected to histological analysis and inflammation (A), chondrocyte death (B), cartilage surface erosion (C), bone erosion (D) on day 36 after crocin treatment. Norm: normal rats; Cont: control CIA rats. Data are presented as the mean ± SE (n = 15). *p < 0.05, **p < 0.01, compared with the Cont.
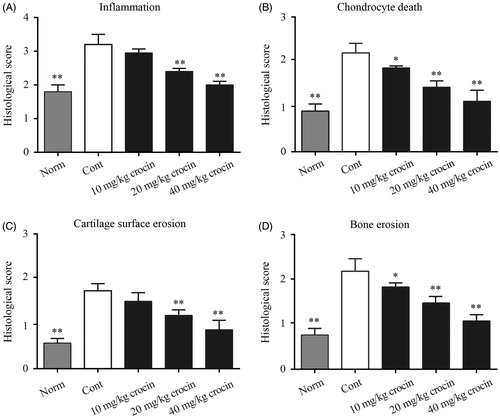
Figure 3. The effects of crocin on protein expression of MMP-1, MMP-3 and MMP-13 in serum in CIA rats. Serum samples were separated by SDS-PAGE and MMPs levels were measured by immunoblotting. The figure represents the protein expression levels and the corresponding densitogram of MMP-1 (A); MMP-3 (B); MMP-13 (C) and β-actin (D). Norm: normal rats; Cont: control CIA rats. Data are presented as the mean ± SE (n = 15). *p < 0.05, **p < 0.01, compared with the Cont.
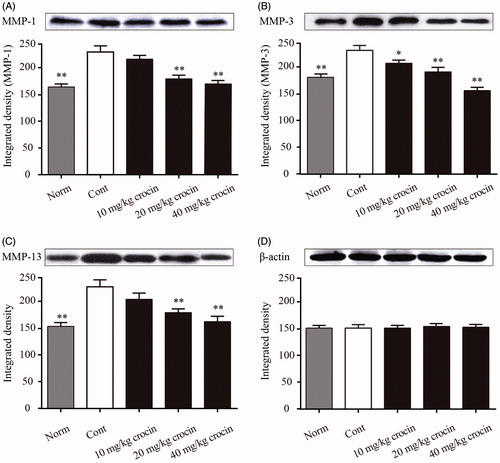
Figure 4. The effects of crocin on the release of TNF-α, IL-17, IL-6 and CXCL8 into the serum of CIA rats. (A) TNF-α content; (B) IL-17 content; (C) IL-6 content; (D) CXCL8 content. Norm: normal rats; Cont: control CIA rats. Data are presented as the mean ± SE (n = 15). *p < 0.05, **p < 0.01, compared with the Cont.
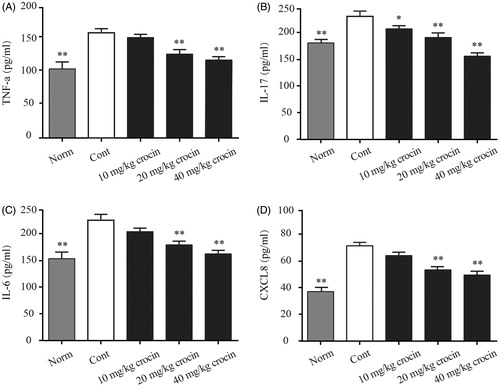
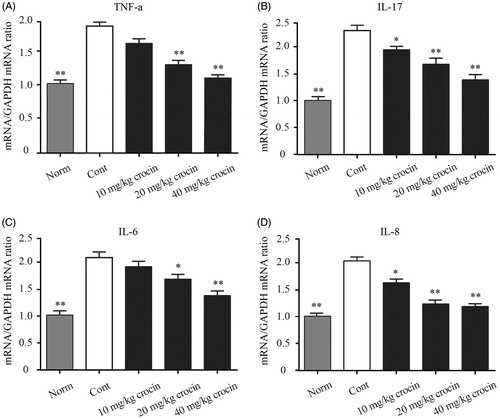
Figure 5. The effect of crocin on the gene expression of pro-inflammatory cytokines. mRNA expression was measured by quantitative RT-PCR in the ankle tissue in CIA rats. (A) TNF-α content; (B) IL-17 content; (C) IL-6 content; (D) CXCL8 content. Statistical analysis was performed using one-way ANOVA followed by the Tukey–Kramer post-test. Norm: normal rats; Cont: control CIA rats. Data are presented as the mean ± SE (n = 15). *p < 0.05, **p < 0.01, compared with the Cont.