Figures & data
Figure 1. Galangin structure.
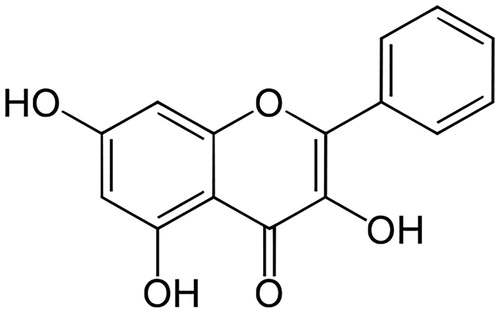
Table 1. Effect of galangin on plasma glucose and insulin levels in rats with streptozotocin-induced hyperglycaemia.
Figure 2. Effect of galangin on abnormal changes in plasma TC and TG levels in rats with streptozotocin-induced hyperglycaemia. Data are presented as mean of six rats per group ± standard error (S.E.). Groups 1 and 2 are not significantly different from each other (a, a; p < 0.05). Groups 4 and 5 are significantly different from Group 3 (b vs. c, ad, cd, ad; p < 0.05). S.E.: standard error; STZ: streptozotocin. Group 1: healthy control rats; Group 2: healthy control +8 mg galangin; Group 3: diabetic control; Group 4: diabetic +8 mg galangin; Group 5: diabetic +600 µg glibenclamide.
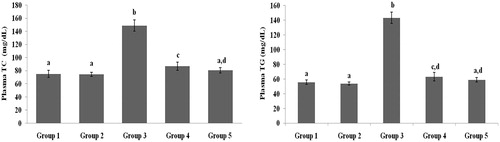
Figure 3. Effect of galangin on abnormal changes in plasma high-density lipoprotein-cholesterol and very-low-density lipoprotein-cholesterol levels in rats with STZ-induced hyperglycaemia. Data are presented as mean of six rats per group ± S.E. Groups 1 and 2 are not significantly different from each other (a, a; p < 0.05). Groups 4 and 5 are significantly different from Group 3 (b vs. a; p < 0.05). Group 1: healthy control rats; Group 2: healthy control +8 mg galangin; Group 3: diabetic control; Group 4: diabetic +8 mg galangin; Group 5: diabetic +600 µg glibenclamide.
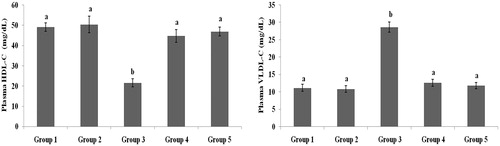
Figure 4. Effect of galangin on abnormal changes in low-density lipoprotein-cholesterol, free fatty acid and phospholipid levels in rats with STZ-induced hyperglycaemia. Data are presented as mean of six rats per group ± S.E. Groups 1 and 2 are not significantly different from each other (a, a; p < 0.05). Groups 4 and 5 are significant different compared to Group 3 (b vs. c, d, ac, a; p < 0.05). Group 1: healthy control rats; Group 2: healthy control +8 mg galangin; Group 3: diabetic control; Group 4: diabetic +8 mg galangin; Group 5: diabetic +600 µg glibenclamide.
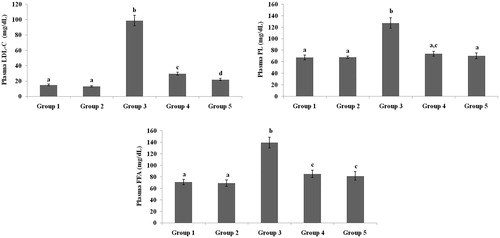
Figure 5. Effect of galangin on abnormal changes in liver total cholesterol and triglyceride levels in rats with STZ-induced hyperglycaemia. Data are presented as mean of six rats per group ± S.E. Groups 1 and 2 are not significantly different from each other (a, a; p < 0.05). Groups 4 and 5 are significantly different from Group 3 (b vs. ac, a; p < 0.05). Group 1: healthy control rats; Group 2: healthy control +8 mg galangin; Group 3: diabetic control; Group 4: diabetic +8 mg galangin; Group 5: diabetic +600 µg glibenclamide.
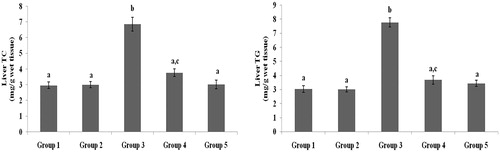
Figure 6. Effect of galangin on abnormal changes in liver free fatty acid and phospholipid levels in rats with STZ-induced hyperglycaemia. Data are presented as mean of six rats per group ± S.E. Groups 1 and 2 are not significantly different from each other (a, a; p < 0.05). Groups 4 and 5 are significantly different from Group 3 (b vs. a, ac; p < 0.05). Group 1: healthy control rats; Group 2: healthy control +8 mg galangin; Group 3: diabetic control; Group 4: diabetic +8 mg galangin; Group 5: diabetic +600 µg glibenclamide.
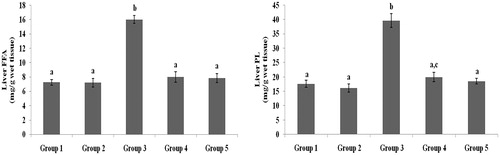
Figure 7. Effect of galangin on abnormal changes of heart total cholesterol and triglyceride levels in rats with STZ-induced hyperglycaemia. Data are presented as mean of six rats per group ± S.E. Groups 1 and 2 are not significantly different from each other (a, a; p < 0.05). Groups 4 and 5 are significantly different from Group 3 (b vs. ac, a, c; p < 0.05). Group 1: healthy control rats; Group 2: healthy control +8 mg galangin; Group 3: diabetic control; Group 4: diabetic +8 mg galangin; Group 5: diabetic +600 µg glibenclamide.
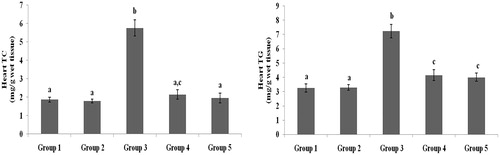
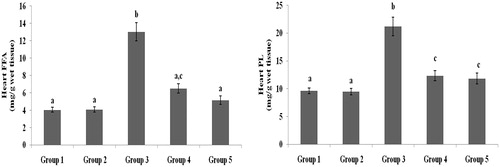
Figure 8. Effect of galangin on abnormal changes in heart free fatty acid and phospholipid levels in rats with STZ-induced hyperglycaemia. Data are presented as mean of six rats per group ± S.E. Groups 1 and 2 are not significantly different from each other (a, a; p < 0.05). Groups 4 and 5 are significantly different from Group 3 (b vs. ac, a, c; p < 0.05). Group 1: healthy control rats; Group 2: healthy control +8 mg galangin; Group 3: diabetic control; Group 4: diabetic +8 mg galangin; Group 5: diabetic +600 µg glibenclamide.