Figures & data
Figure 1. The positive rates of tyrosine hydroxylase (TH) and dopamine transporter (DAT) were assayed by flow cytochemistry (A) and real-time PCR (B) and DA releases were assayed by ELISA (C). TH and DAT positive rates obviously increased in the SAF group at 20 and 100 ng/mL. Moreover, DA releases also increased in the SAF group. **p < 0.01 versus control. The positive rates were expressed as a % of positive cells in the total cells. Differences were evaluated by one-way ANOVA.
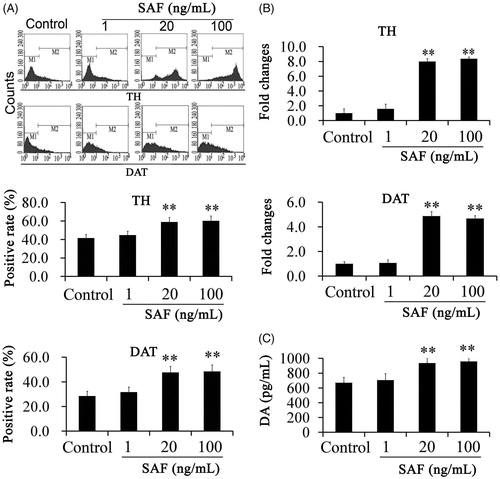
Figure 2. Transplantation of GFP-NSC into PD rats. (A) The number of rotations and the survival rates of animals after transplantation. (B) The distribution and survival of transplanted cells were examined by fluorescence microscopy. **p < 0.01 versus Normal group. #p < 0.05 and ##p < 0.01 versus PD. Differences were evaluated by one-way ANOVA.
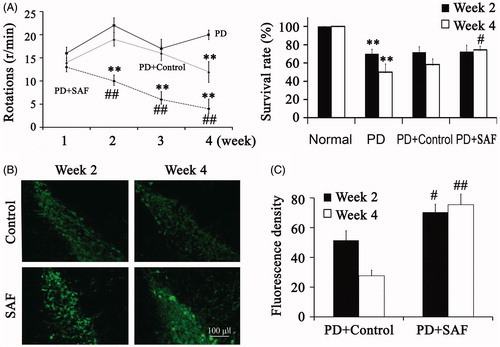
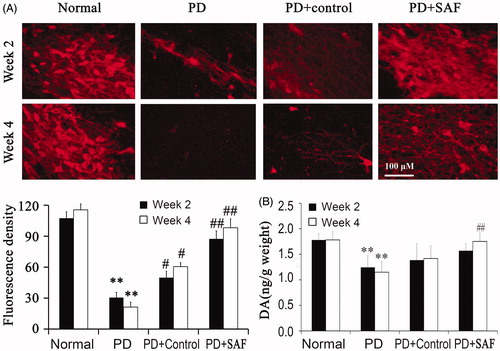
Figure 3. Differentiation and survival of dopaminergic neurons. (A) TH positive rates were examined by immunofluorencence. (B) DA release was examined by ELISA. **p < 0.01 versus Normal group. #p < 0.05 and ##p < 0.01 versus PD. Differences were evaluated by one-way ANOVA.