
Figures & data
Figure 1. Appearance of the liver (A) and haematoxylin and eosin (H&E) analysis (B). I: control; II: model; III: pioglitazone; IV: high dose of TangGanJian (TGJ: 24.8 g/kg); V: middle dose of TGJ (12.4 g/kg); VI: low dose of TGJ (6.2 g/kg).
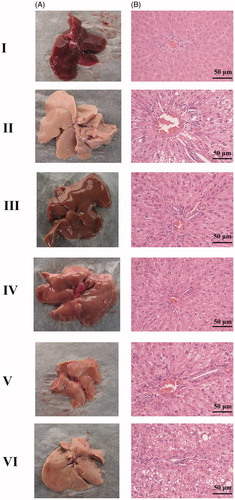
Table 1. The fasting plasma insulin, glucose (FBG) and plasma glucose levels (2hPG) of rats.
Table 2. The aspartate transaminase (AST) and alanine transferase (ALT) levels of rats.
Table 3. Content of tumour necrosis factor-α (TNF-α), interleukin-6 (IL-6), interleukin 1 beta (IL-1β) and C-reactive protein (CRP) in rat serum.
Table 4. Contents of superoxide dismutase (SOD), malondialdehyde (MDA) and glutathione peroxidase (GSH-PX) in rat liver.