Figures & data
Figure 1. Chemical structure of shikonin (Zhao et al. Citation2017).
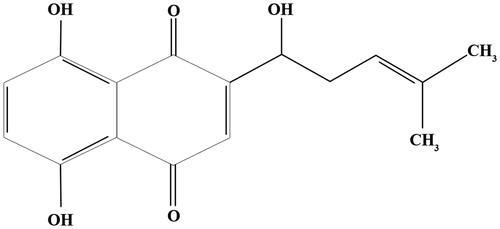
Table 1. Primers used in qRT-PCR.
Figure 2. Effect of SHI on hPDLC proliferation. hPDLCs were exposed to SHI (0.125, 0.25, 0.5, 1, and 2 μg/mL) for 1, 3 and 7 days. Cell proliferation was measured using the MTT assay. The data are expressed as the percentage of the control (containing medium only). Error bars indicate mean ± SEM (n = 3). *p < 0.05 versus the control. Statistical analysis was performed using One-way ANOVA and Tukey’s post hoc test.
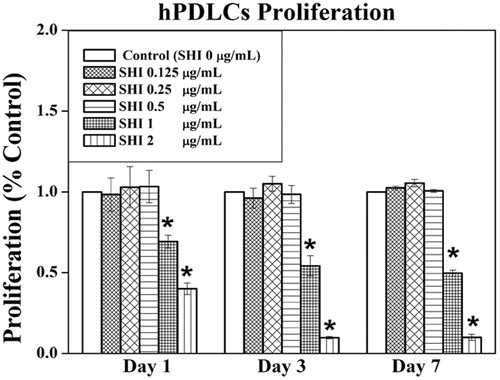
Figure 3. Effect of SHI on hPDLC morphology. hPDLCs were pretreated with SHI (0.25 and 0.5 µg/mL) for 1 h and then stimulated with LPS for 12 h. Images were then captured using a Nikon Eclipse TS100 light microscope (A) and a Nikon Eclipse TE2000-U fluorescence microscope (B).
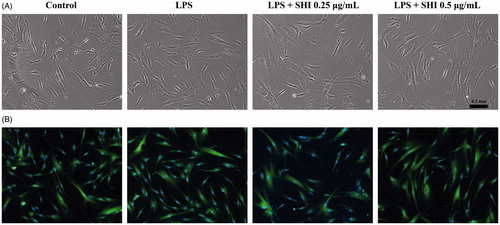
Figure 4. Effect of SHI on hPDLC gene expression. hPDLCs were pretreated with SHI (0.25 and 0.5 µg/mL) for 1 h and then stimulated with LPS for 1 and 3 days, after which total RNA was collected. After RNA extraction, first strand cDNA was synthesized. The cDNA sample was then amplified using qRT-PCR. The expression of the target gene was first normalized to 18s and then further converted to the percentage of the control. Error bars indicate mean ± SEM (n = 3). #p < 0.05 versus the control while *p < 0.05 versus the LPS group. Statistical analysis was performed using One-way ANOVA and Tukey’s post hoc test.
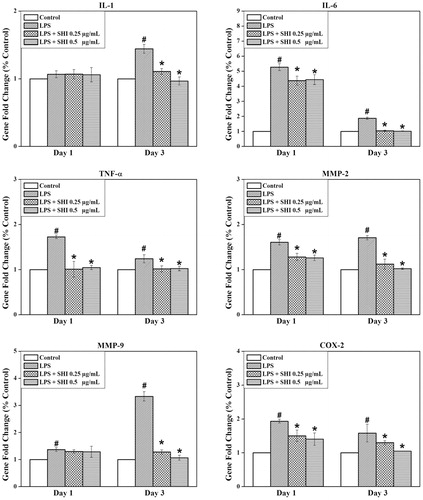
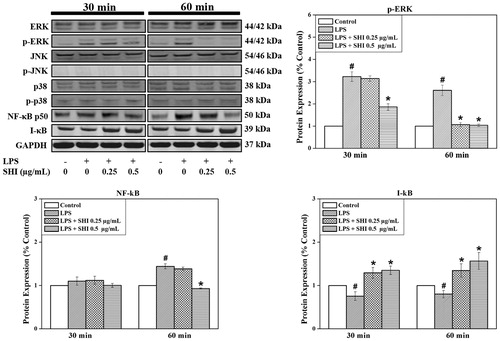
Figure 5. SHI-induced signaling pathways in hPDLCs. hPDLCs were pretreated with SHI (0.25 and 0.5 µg/mL) for 1 h and then stimulated with LPS for 30 and 60 min, after which, total protein was collected. The levels of protein expression were determined by western blotting. The expression of p-ERK was converted to the percentage of total ERK; expression of NF-κB and I-κB were converted to GAPDH. Then the data was further converted into the percentage of the control group. Error bars indicate mean ± SEM (n = 3). #p < 0.05 versus the control while *p < 0.05 versus the LPS group. Statistical analysis was performed using One-way ANOVA and Tukey’s post hoc test.