Figures & data
Table 1. Alteration of rat weight before and after DEN treatment (Mean ± S.E.).
Table 2. Survival and cancer induction rate of DEN-induced HCC rats.
Figure 1. Photographs of the livers of healthy (a), DEN-induced HCC rat (b) and HCC rat administered 1,4-GL (c); Hepatic pathological changes (HE ×100) in healthy rat (d), DEN-induced HCC rat (e), and HCC rat administered 1,4-GL (f).
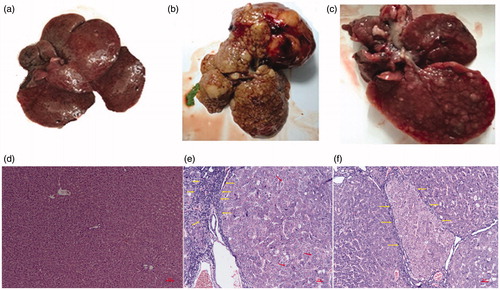
Figure 2. The Scores plot of PCA (a) and PLS-DA (b) by 1HNMR spectra of rat serum (1: Control group, 2: DEN group, 3: DEN + 1,4-GL group).
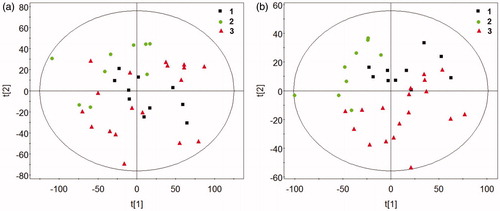
Table 3. Information of rat serum metabolites for classification observed by 1HNMR spectra.
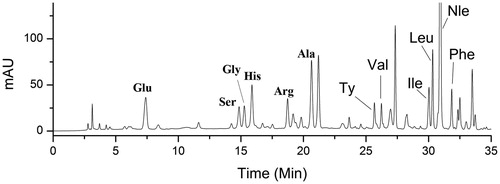
Figure 3. Typical HPLC-UV chromatogram (254 nm) of rat serum after PITC derivatization. Glu: glutamate; Ser: serine; Gly: glycine; His: histidine; Arg: arginine; Ala: alanine; Ty: tyrosine; Val: valine; Ile: isoleucine; Leu: leucine; Nle: norleucine; Phe: Phenylalanine; PITC: phenylisothiocyanate.