Figures & data
Figure 1. Chang-wei-qing ameliorated colitis-associated tumour development in mouse model. (A) Tumour incidence. (B) Length of colon. (C) Tumour number. (D) Tumour size. (E) Colitis severity scores. (F) Representative histopathological images. NT: none treated, control group; AOM/DSS: treated with AOM, DSS and PBS, colitis-associated cancer group; AOM/DSS/Bif: treated with AOM, DSS and Bifico; AOM/DSS/CWQL: treated with AOM, DSS and low dose Chang-wei-qing; AOM/DSS/CWQH: treated with AOM, DSS and high dose Chang-wei-qing. Data are means ± SD (n = 6 for each group). Experiments were repeated for three times. *p < 0.05, **p < 0.01 vs. AOM/DSS group.
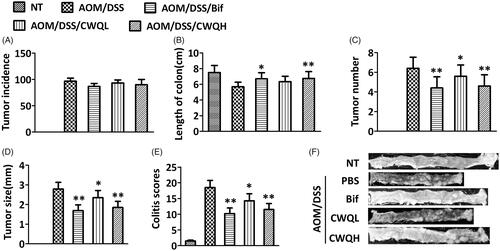
Figure 2. Chang-wei-qing ameliorated microbiota changes in CAC mouse model. (A) The total count of bacteria. (B) The relative numbers of Faecalibacterium prausnitzii. Faecal microbiota was assessed by quantitative PCR using specific primers. (C) Activity of β-glucuronidase was measured in the colon content. (D) d-Lactose and (E) endotoxin were measured in the peripheral blood. Data are means ± SD (n = 6 for each group). Experiments were repeated for three times. *p < 0.05, **p < 0.01 vs. AOM/DSS group.
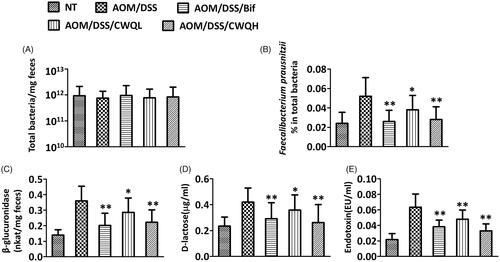
Figure 3. Chang-wei-qing ameliorated pro-inflammatory response in CAC mouse model. Cytokine levels in colonic tissue were measured by ELISA. (A) IL-1β. (B) IFN-γ. (C) IL-6. (D) IL-17. (E) TNF-α. Data are means ± SD (n = 6 for each group). Experiments were repeated for three times. **p < 0.01 vs. AOM/DSS group.
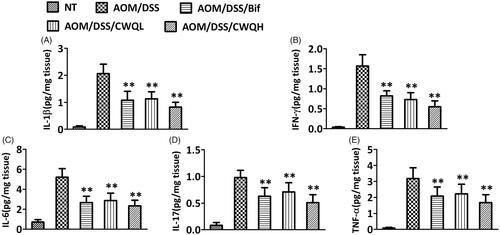
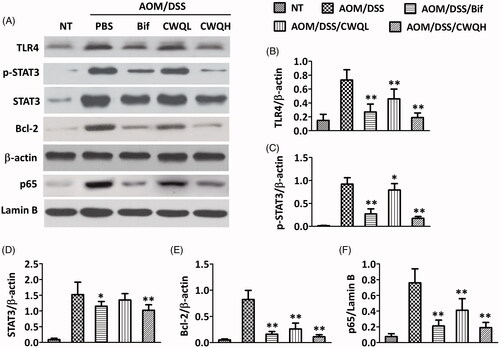
Figure 4. Chang-wei-qing decreased TLR4/NF-κB and STAT3 signalling genes in CAC mouse model. (A) Genes levels in colonic tissue were measured by western blotting. (B–E) Semi-quantitative analysis of TLR4, p-STAT3, STAT3 and Bcl-2 proteins expression compared with β-actin. (F) Semi-quantitative analysis of p65 protein expression compared with lamin B. Data are means ± SD. Experiments were repeated for three times. *p < 0.05, **p < 0.01 vs. AOM/DSS group.