Figures & data
Figure 1. Chemical structure of BJJS (A) and effects of BJJS on viability of HepG2 cells (B). Cell viability was examined using the MTT assay. Data (% viability) are expressed as the mean ± SD (n = 6).
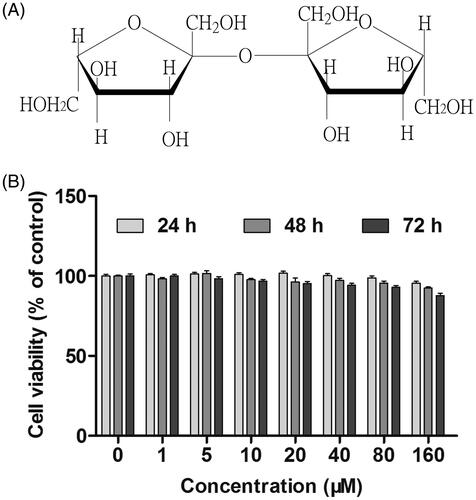
Figure 2. Effects of BJJS on protein and mRNA levels of P-gp in HepG2 cells (A, B, and C) and C57 mice (E, F, and G). Protein and mRNA expression levels were measured using Western blot and real-time PCR analysis, respectively. The correlation between P-gp mRNA levels and protein levels in HepG2 cells (D) and C57 mice (H) was analyzed using Person analysis, respectively. Densitometry results were related to β-actin and are presented as a percentage of control. GAPDH was used as a housekeeping gene for cells. Data are represented as the mean ± SD (n = 3). *p < 0.05 and ***p < 0.001 compared with the control group by using one-way ANOVA analysis.
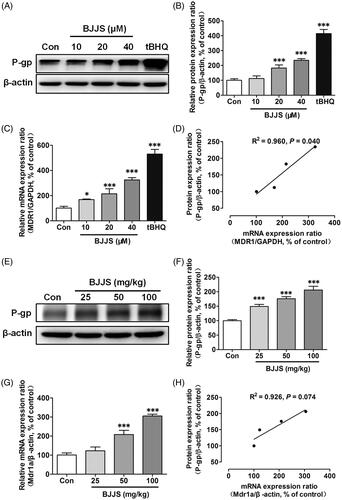
Figure 3. Effects of BJJS on the protein levels of Keap1 (A and B), total Nrf2 (A and C), and nuclear Nrf2 (D and E) in HepG2 cells. Effects of BJJS on the protein levels of Keap1 (F and G), and Nrf2 (F and H) in C57 mice. Protein expression levels were measured by using Western blot analysis. Densitometry results were related to β-actin and presented as the percentage of control. Data are represented as the mean ± SD (n = 3). **p < 0.01 and ***p < 0.001 compared with the control group by using one-way ANOVA analysis.
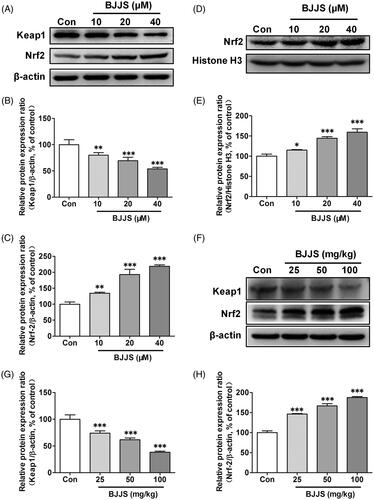
Figure 4. Mediation effects of Nrf2 on P-gp expression induced by BJJS. HepG2 cells were transfected with Nrf2-specific siRNA (siNrf2) or control siRNA (siCon). Protein levels of P-gp were measured using Western blot analysis. Densitometry results were related to β-actin and presented as percentage of control. Data are represented as the mean ± SD (n = 3). **p < 0.01 and ***p < 0.001 compared to the control group by using one-way ANOVA analysis.
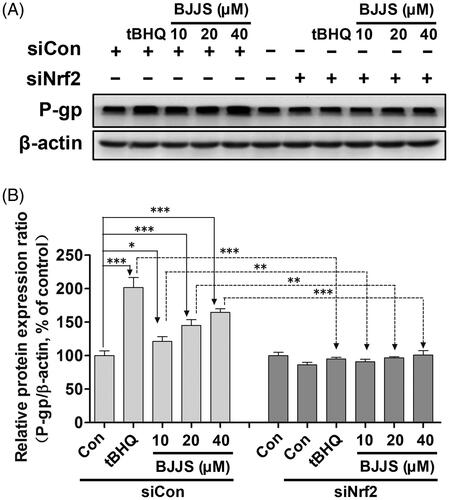
Figure 5. Effects of BJJS on transport activity of P-gp. Rhodamine 123, a typical P-gp substrate, was selected as the probe substrate to evaluate the efflux activity of P-gp. Rhodamine 123 accumulation in HepG2 cells was measured by flow cytometry. Data are expressed as percentage of control and represent the mean ± SD (n = 3). **p < 0.01 compared with the control group by using one-way ANOVA analysis.
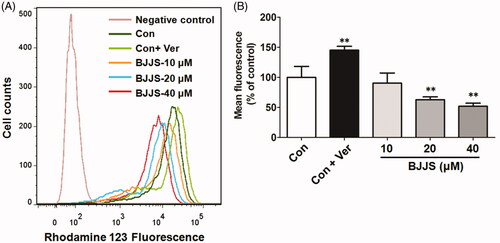
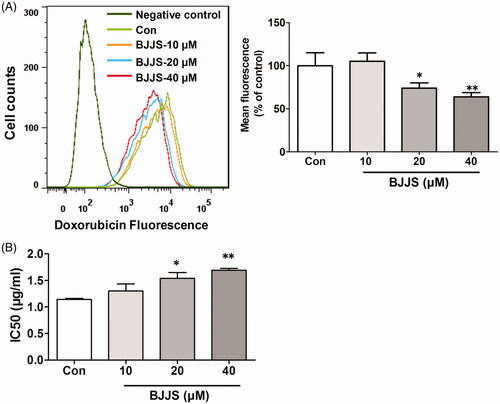
Figure 6. Effects of BJJS against doxorubicin cytotoxicity. The antitumor drug doxorubicin (a P-gp substrate) was used to evaluate the effects of BJJS against doxorubicin cytotoxicity. Doxorubicin accumulation in HepG2 cells was measured by flow cytometry (A). Cell viability was evaluated by the MTT assay. Cytotoxicity was expressed as the concentration of doxorubicin inhibiting cell growth by 50% (IC50) (B). Data shown represent the mean ± SD (n = 3). *p < 0.05 and **p < 0.01 compared with the control group by using one-way ANOVA analysis.