Figures & data
Table 1. Primers for GLUT2, GLUT4 and GAPDH gene.
Figure 1. Comparison of body weight change during the study period between the studied groups (SB: Satureja bachtiarica); *Significant difference compared to values before treatment (***p < 0.001 and *< 0.05).
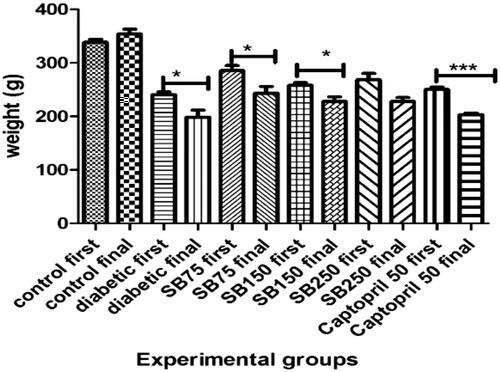
Figure 2. Comparison of blood glucose levels between the studied groups (SB: Satureja Bacchitaria); *Show significant difference compared to the diabetic group (***p < 0.001 and **< 0.01).
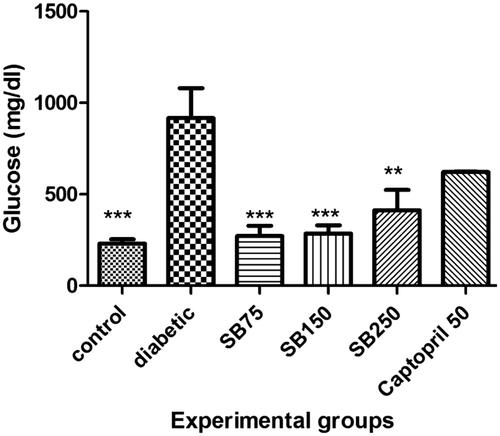
Figure 3. Comparison of serum triglyceride (TG) (A), total cholesterol (TC) (B), and high-density lipoprotein-cholesterol (HDL-C) (C) levels between the studied groups (SB: Satureja bachtiarica). In Figure A: *Show significant difference compared to the diabetic group (*p < 0.05).
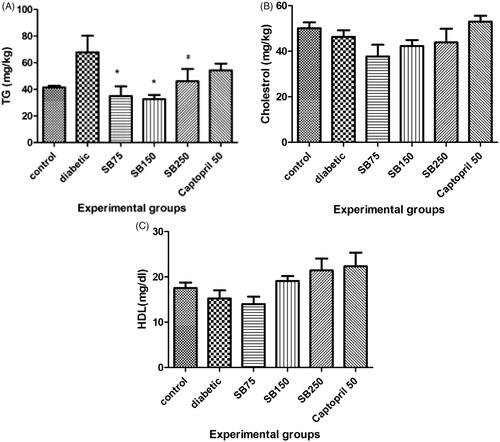
Figure 4. Comparison of serum creatinine (A) and urea (B) levels between the studied groups (SB: Satureja bachtiarica).
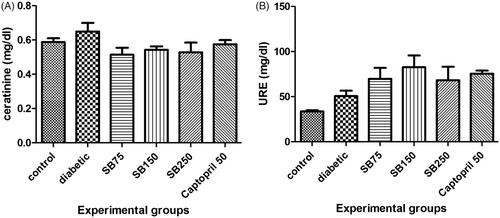
Figure 5. Comparison of serum albumin level between the studied groups (SB: Satureja bachtiarica).
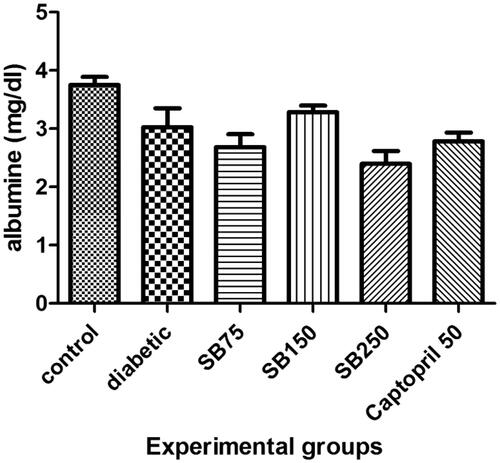
Figure 6. Comparison of alkaline phosphatase (A), alanine aminotransferase (B), aspartate aminotransferase (C) and gamma glutamyltransferase (D) between the studied groups (SB: Satureja bachtiarica). *Show significant difference compared to the diabetic group (***p < 0.001, **< 0.01 and *< 0.05).
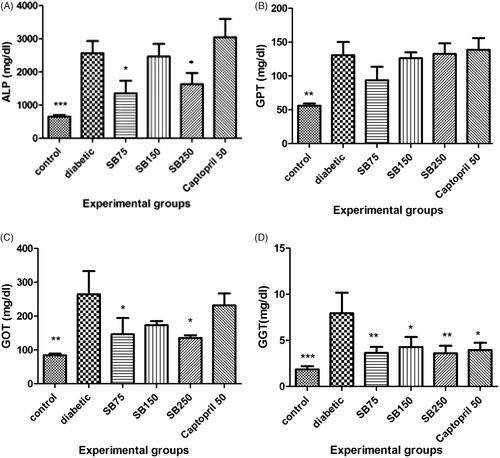
Figure 7. Comparison of serum total antioxidant capacity (A) and malondialdehyde level (B) among the studied groups (SB: Satureja bachtiarica). *Show significant difference compared to diabetic group (***p < 0.001 and *< 0.05).
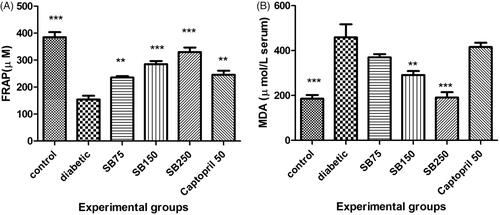
Table 2. Comparison of GLUT2 and GLUT4 gene expression between studied groups.
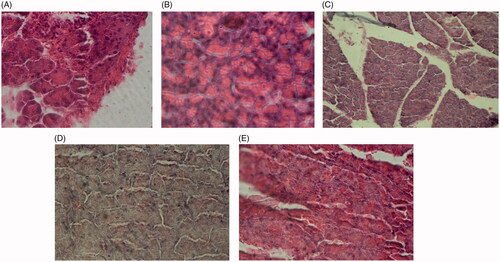
Image 1. Liver tissue sections of control rats (A), diabetic rats (B), diabetic rats treated with 75 mg/kg of S. bachtiarica extract (C), diabetic rats treated with 150 mg/kg of S. bachtiarica extract (D) and diabetic rats treated with 250 mg/kg of S. bachtiarica extract (E); haematoxylin-eosin staining; magnification x40.
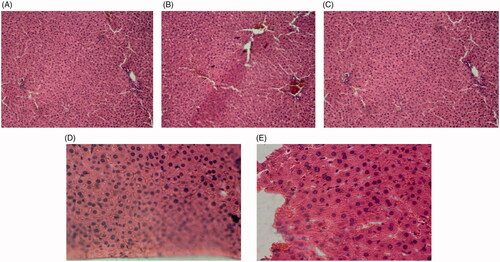
Image 2. Renal tissue sections of control rats (A), diabetic rats (B), diabetic rats treated with 75 mg/kg of S. bachtiarica extract (C), diabetic rats treated with 150 mg/kg of S. bachtiarica extract (D) and diabetic rats treated with 250 mg/kg of S. bachtiarica extract (E); haematoxylin-eosin staining; magnification x40.
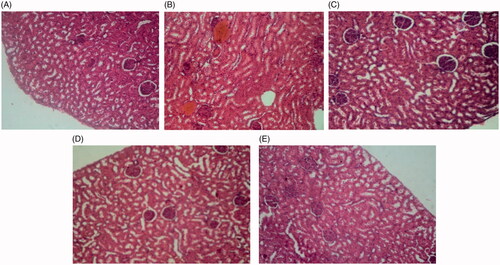
Image 3. Pancreas tissue sections of control rats (A), diabetic rats (B), diabetic rats treated with 75 mg/kg of S. bachtiarica extract (C), diabetic rats treated with 150 mg/kg of S. bachtiarica extract (D) and diabetic rats treated with 250 mg/kg of S. bachtiarica extract (E); haematoxylin-eosin staining; magnification x40.