Figures & data
Figure 1. Representative changes of the regional cerebral blood flow (rCBF) at ischaemic zones and mean arterial pressure (MAP) before MCAO, during MCAO and early reperfusion periods. All data are presented as mean ± SEM. All values are in physiological range except to rCBF during MCA occlusion in control ischaemic (IR) and treated ischaemic (IR + DA) groups. *As significant difference compared to sham group at same time (p < 0.05).
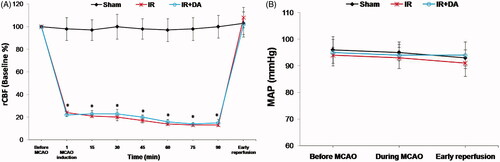
Table 1. The number of rats in each group that was distinctly used for assessment of each parameter.
Figure 2. Photograph (A) shows the coronal sections of the brains stained with 2, 3, 5-triphenyl tetrazolium chloride (TTC) at the end of the experiment in sham rats, control ischaemic group (IR) and ischaemic rats treated with Dorema aucheri extract (IR + DA). Ischaemic zones are coloured white, whereas non-ischaemic zones are stained red (black). The graphs show the quantified total (B), cortical (C) and striatal (D) infarct volume (mm3) for mentioned groups at the termination of the experiment. All values are expressed as mean ± SEM. **As significant difference compared to IR group (p < 0.001).
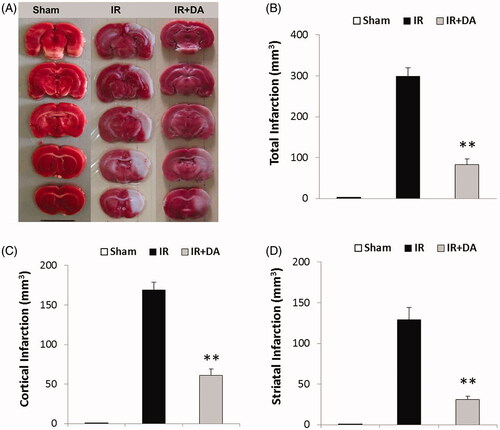
Figure 3. The graph shows the percent of tissue swelling in the ischaemic (right) hemispheres of sham rats, control ischaemic group (IR) and ischaemic rats treated with Dorema aucheri extract (IR + DA) at the end of the experiment. All values are expressed as mean ± SEM. **As significant difference compared to IR group (p < 0.01).
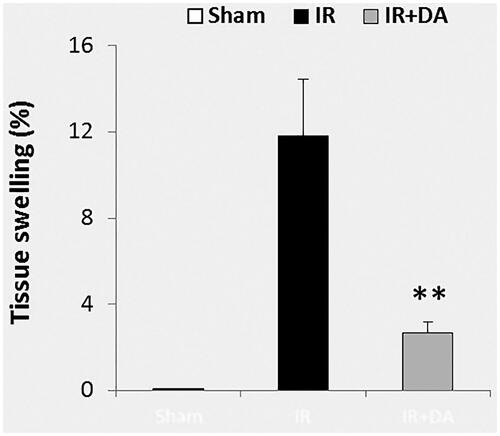
Figure 4. The graphs A, B and C show the contents (nmol/mg protein) of malondialdehyde (MDA), NOx (nitrite and nitrate) and glutathione (GSH), respectively, in the right (ischaemic) hemispheres in sham rats, control ischaemic group (IR) and ischaemic rats treated with Dorema aucheri extract (IR + DA) at the end of the experiment. The graphs D and E also show the superoxide dismutase (SOD) and catalase (CAT) activities (U/mg protein), respectively. All values are expressed as mean ± SEM. **As significant difference compared to sham group (p < 0.01). &&As significant difference compared to IR group (p < 0.01).
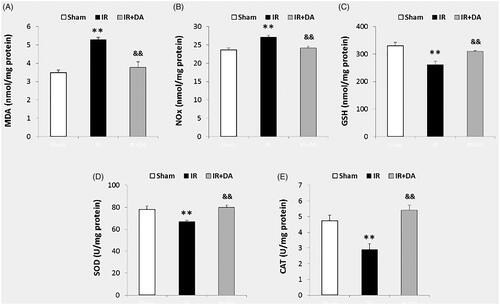
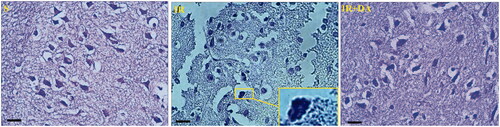
Figure 5. The photomicrographs illustrating the Cresyl violet-stained coronal sections from right hemispheres of sham (S), control ischaemic (IR) and Dorema aucheri-treated ischaemic (IR + DA) groups. The enlarged rectangle at a stained section of the control IR group at higher magnification (1000×) indicates apoptotic bodies and pyknotic nuclei with shrunken appearance (Scale bar = 20 µm, 400×).