
Figures & data
Figure 1. The chemical compounds found in Paederia foetida.
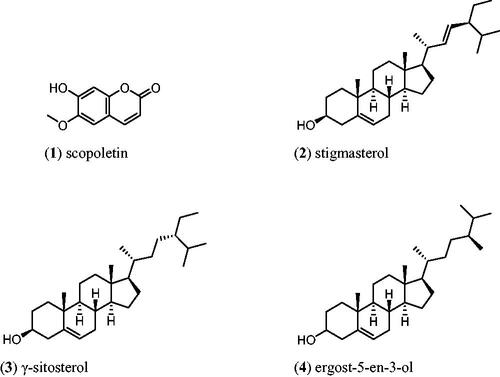
Figure 2. Percentage inhibition of α-amylase by different extracts of Paederia foetida twig from Pahang, Malaysia. The different extracts were compared with acarbose and p < 0.05 (p = 0.0001). *indicates significance at the 0.05 level, **indicates significance at the 0.01 level.
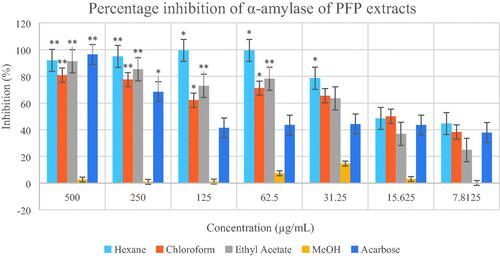
Figure 3. Percentage inhibition of α-amylase by different extracts of Paederia foetida twig from Johor, Malaysia. The different extracts were compared with acarbose and p < 0.05 (p = 0.0101). *indicates significance at the 0.05 level.
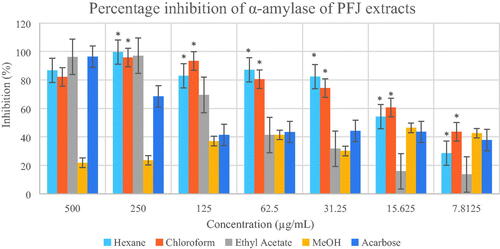
Figure 4. Percentage inhibition of α-glucosidase by different extracts of Paederia foetida twig from Pahang, Malaysia. The different extracts were compared with acarbose and p < 0.05 (p = 0.0080).
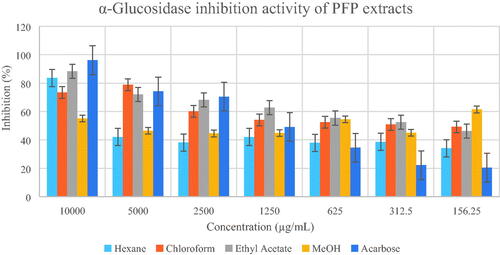
Figure 5. Percentage inhibition of α-glucosidase by different extracts of Paederia foetida twig from Johor, Malaysia. The different extracts were compared with acarbose and p < 0.05 (p = 0.0019). *indicates significance at the 0.05 level.
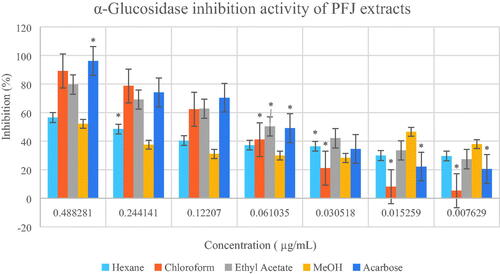
Table 1. IC50 values for α-glucosidase and α-amylase inhibition by extracts of Paederia foetida twig.
Figure 6. Percentage inhibition of DPPH scavenging activities by different extracts of Paederia foetida twig from Pahang, Malaysia. The different extracts were compared with α-tocopherol and ascorbic acid, p < 0.05 (p = 0.0021). * indicates significance at the 0.05 level.
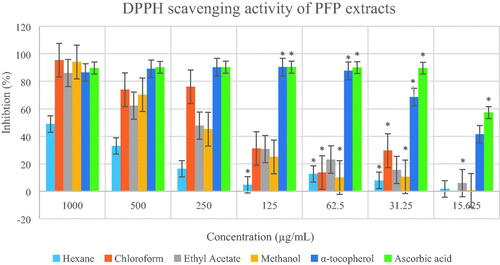
Figure 7. Percentage inhibition of DPPH scavenging activities by different extracts of Paederia foetida twig from Johor, Malaysia. The different extracts were compared with α-tocopherol and ascorbic acid, p < 0.05 (p = 0.0001). * indicates significance at the 0.05 level, ** indicates significance at the 0.01 level.
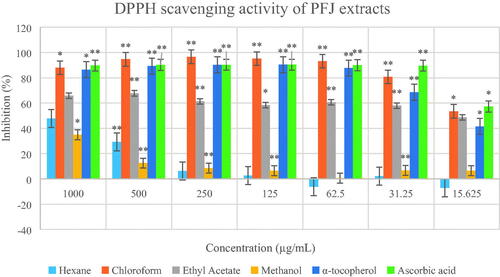
Figure 8. Binding of scopoletin to α-amylase pocket. (a) 2D-diagram of ligand interaction. (b) receptor–ligand interaction. (c) Hydrophobic surface. (d) Hydrogen bond surface.
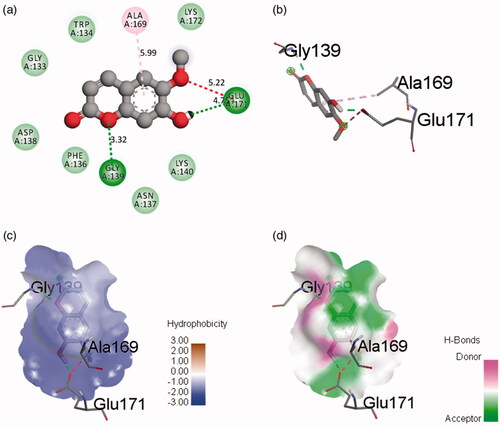
Figure 9. Binding of scopoletin to α-glucosidase pocket. (a) 2D-diagram of ligand interaction. (b) receptor–ligand interaction. (c) Hydrophobic surface. (d) Hydrogen bond surface.
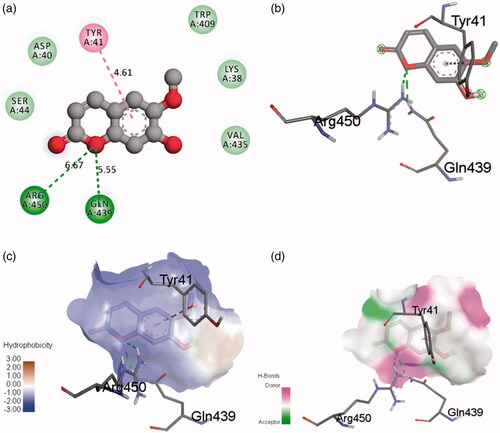
Table 2. β-Carotene bleaching activity and IC50 values of DPPH by extracts of Paederia foetida twig.
Table 3. Binding interaction of the complex ligands.