Figures & data
Table 1. Nucleotide sequences of primers used for qRT-PCR.
Figure 1. Cell viability of BRL cells measured by CCK-8 assay. The results are presented as a percentage of the control. Cell viability of BRL cells following different concentrations of l-NAT exposure was measured by CCK-8 assay. BRL cells were treated with 200 μM H2O2 with or without a series of concentrations of l-NAT (0, 2.5, 5, 10, 20 or 50 μM) for 18 hours. *p < 0.05, **p < 0.01, ***p < 0.001 versus untreated group and ##p < 0.01 compared with related H2O2 group or I/R group.
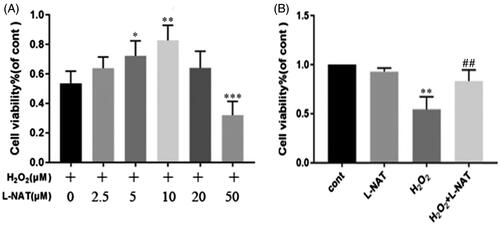
Figure 2. Liver damage was analyzed by liver histology (representative H&E staining; original magnifications, 100× magnification). (a) Sham, (b) l-NAT, (c) I/R, (d) I/R + l-NAT.
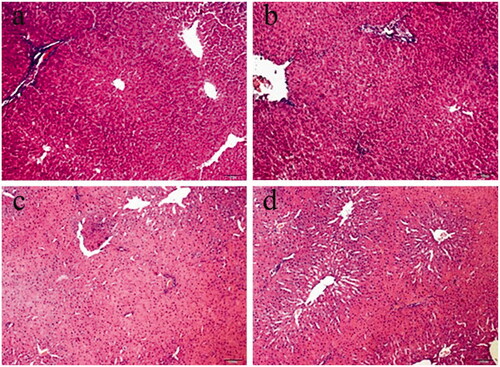
Figure 3. Changes in the expression of RIP2 after HIRI. (A) Relative mRNA levels of RIP2 in BRL cells. Detected by quantitative qRT-PCR (n = 3). (B) Western blot analysis of RIP2 protein expression in BRL cells. (C) Immunofluorescence staining (200X) in BRL cells. (a) Cont, (b) H2O2, (c) H2O2+l-NAT. (D) Relative mRNA levels of RIP2 in rat liver tissues detected using quantitative qRT-PCR (n = 3). (E) Western blot analysis of RIIP2 protein expression in rat liver tissues. (F) Immunofluorescence staining (200×) in rat liver tissues (d) sham, (e) I/R, (f) l-NAT. Data are mean ± SD; **p < 0.01, *p < 0.05 compared with the related Cont group or sham group, ##p < 0.01, #p < 0.05 compared with related H2O2 group or I/R group.
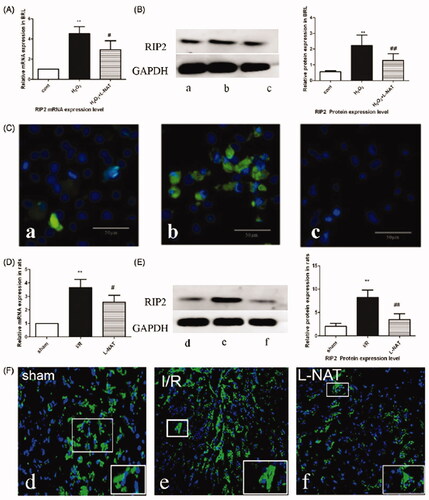
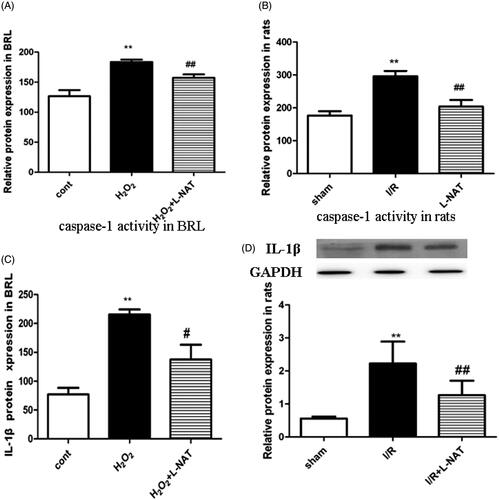
Figure 4. Changes of Caspase-1 viability and IL-1β expression in vitro and in vivo. (A) Relative Caspase-1 viability in BRL cells. (n = 3). (B) Relative Caspase-1 viability in rat liver tissues. (n = 3). Data are mean ± SD; **p < 0.01, *p < 0.05 compared with the related CON group or sham group, ##p < 0.01, #p < 0.05 compared with related H2O2 group or I/R group. (C) Relative protein levels of IL-1β in BRL cells detected using ELISA (n = 3). (D) Western blot analysis of IL-1β protein expression in rat liver tissues (n = 3).