Figures & data
Figure 1. QCSL inhibits the growth of T24 xenografts and increases the survival time of T24 xenograft mice. Thirty mice were randomly divided into five groups (n = 6 each): control group; 20 mg/kg XAV-939 group; 100 mg/kg QCSL group; 200 mg/kg QCSL group and 400 mg/kg QCSL group. (A) Images of T24 xenografts treated with 20 mg/kg XAV-939 or different concentrations of QCSL for 20 days. (B) The volume of T24 xenografts in different groups. (C) Changes in survival time during treatment with XAV-939 or QCSL. ***p < 0.001 compared to control group.
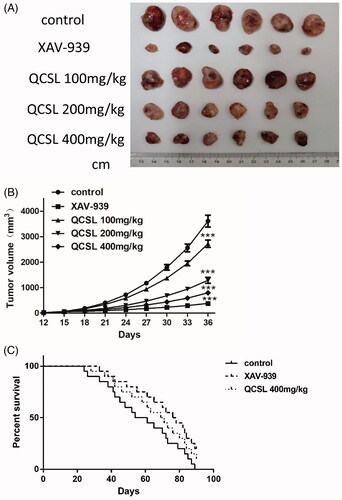
Figure 2. Histological examination of T24 xenografts (H&E staining). (A) Control group; (B) 20 mg/kg XAV-939 group; (C) 100 mg/kg QCSL group; (D) 200 mg/kg QCSL group; (E) 400 mg/kg QCSL group. Scale bars: 100 μm.
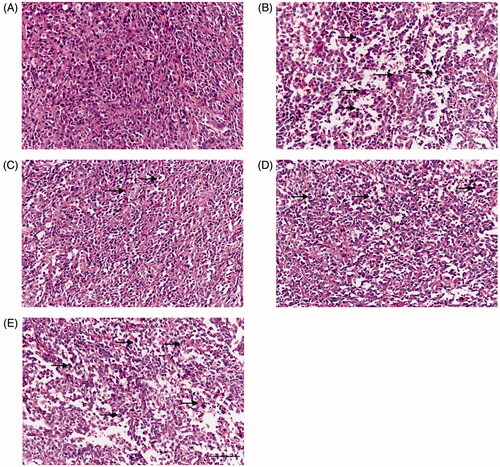
Figure 3. TUNEL staining of T24 xenografts. (A) Control group; (B) 20 mg/kg XAV-939 group; (C) 100 mg/kg QCSL group; (D) 200 mg/kg QCSL group; (E) 400 mg/kg QCSL group; (F) Apoptosis rates of groups with different treatments. ***p < 0.001 compared to control group. Scale bars: 100 μm.
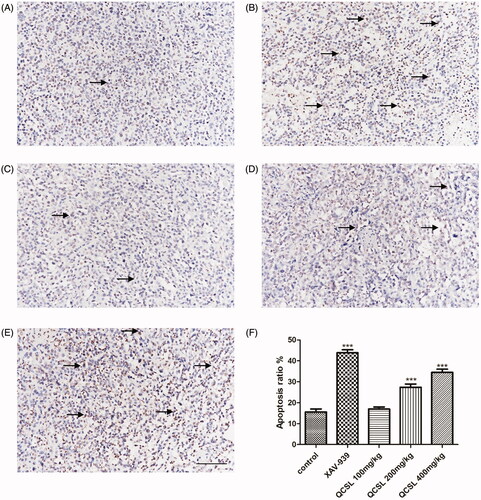
Figure 4. QCSL inhibits tumour growth via regulation of the WNT/β-catenin pathway. (A) The mRNA expression levels of β-catenin, survivin, c-myc and cyclin D1 were measured by real-time PCR. (B) The protein expression levels of β-catenin, survivin, c-myc and cyclin D1 were analysed by western blot. ***p < 0.001 compared to control group.
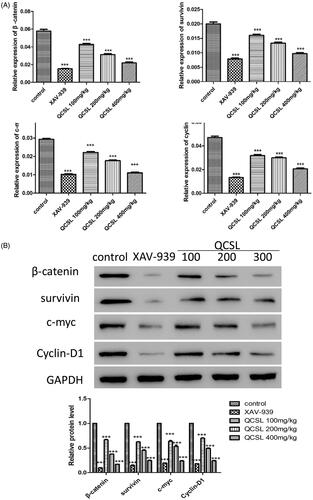
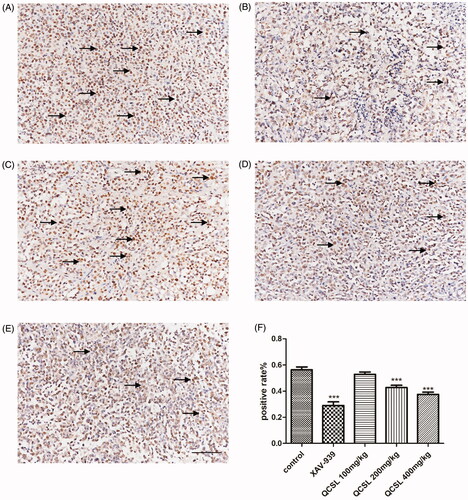
Figure 5. Representative image of Ki-67 staining in xenograft tumour sections. (A) Control group; (B) 20 mg/kg XAV-939 group; (C) 100 mg/kg QCSL group; (D) 200 mg/kg QCSL group; (E) 400 mg/kg QCSL group. (F) Ki-67 positive rates of groups with different treatments. ***p < 0.001 compared to control group. Scale bars: 100 μm.