Figures & data
Figure 1. High-performance liquid chromatography (HPLC) chromatograms of Ephedrae Herba methanol extract (EHM) and its active compound, ephedrine. A, the chromatogram of EHM; B, chromatogram of ephedrine. HPLC, Shimadzu; pump, LC-20AD; auto-sampler, SIL-20A; detector, SPD-M20A; column oven, CTO-20A. Mobile phase, mixture of sodium lauryl sulphate, acetonitrile, and phosphoric acid (640:360:1). Column, YMC-Triart C18, 250 × 4.6 mm, 5 μm; column temperature, 45 °C; flow rate, 1.5 mL/min; injection volume, 10 μL.
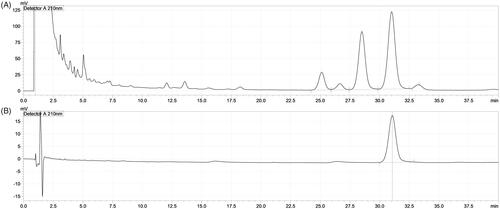
Figure 2. Hyperlipidaemia induction in mice and EHM administration. The mice were fed a normal or high-fat diet (HFD) for 6 weeks before group assignment. EHM was orally administered to the EHM group for the last 3 weeks. NOR: normal diet-fed control mice (n = 8), CON: HFD-fed hyperlipidaemic mice (n = 8), EHM: HFD-fed and EHM-administered mice (n = 8).
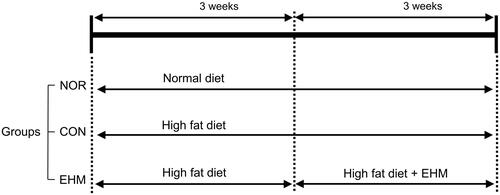
Figure 3. Effects of EHM on body weights, blood levels of total cholesterol, high-density lipoprotein (HDL)-cholesterol, and triglycerides in hyperlipidaemic mice. Body weights (A) were measured every 2 weeks. The levels of total cholesterol (B), HDL-cholesterol (C), and triglycerides (D) in blood serum were determined via spectrophotometry. NOR: normal diet-fed control mice (n = 8), CON: HFD-fed hyperlipidaemic mice (n = 8), EHM: HFD-fed and EHM-administered mice (n = 8). Values are presented as the means ± standard deviation (SD). ###p < 0.001 compared to the NOR group; *p < 0.05 compared to the CON group.
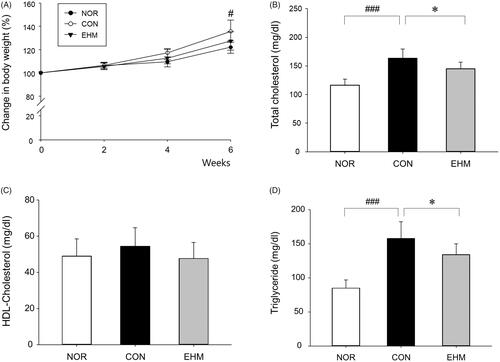
Figure 4. Effects of EHM on lipid peroxidation and blood alanine aminotransferase (ALT) levels in hyperlipidemic mice. Lipid peroxidation in liver tissues and blood ALT levels were determined via spectrophotometry. NOR: normal diet-fed control mice (n = 8), CON: HFD-fed hyperlipidaemic mice (n = 8), EHM: HFD-fed and EHM-administered mice (n = 8). Values are presented as means ± SD. ##p < 0.01 and ###p < 0.001 compared to the NOR group.
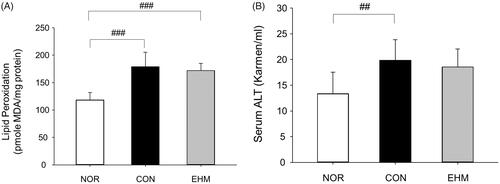
Figure 5. Effects of EHM on the expression of genes in the livers of hyperlipidaemic mice. To identify genes via quantitative analysis and hierarchical clustering, MeV software ver. 4.0 was used. Red indicates genes showing ≥2-fold up-regulated expression compared to that in the NOR group; green indicates genes showing ≥2-fold down-regulated expression compared with that in the NOR group. N: normal diet-fed control mice (NOR group), C: HFD-fed hyperlipidaemic mice (CON group), E: HFD-fed and EHM-administered mice (EHM group).
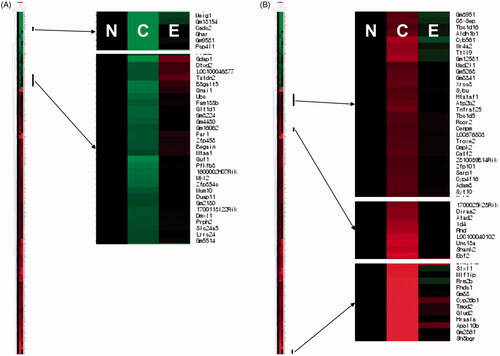
Figure 6. Line plot of alterations in liver gene expression in hyperlipidemic mice. Raw fold values (A) for gene expression compared with that in the NOR group were converted to log values (B) for each differentially expressed gene, and the numbers of up-regulated (C), down-regulated (D), and restored (C, D) genes were reported. NOR: normal diet-fed control mice, CON: HFD-fed hyperlipidemic mice, EHM: HFD-fed and EHM-administered mice.
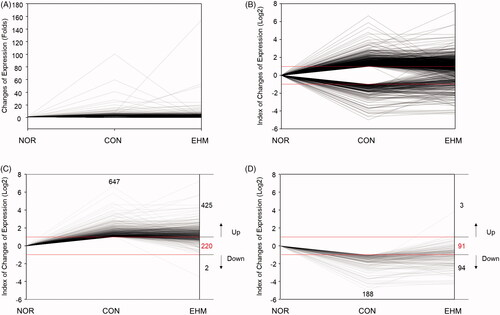
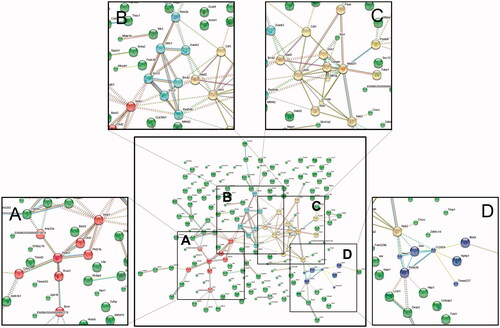
Figure 7. Protein network analysis using STRING data resources. Information regarding the restoration of gene expression after EHM administration in hyperlipidemic mice was uploaded to the STRING database (version 11.0) to investigate interactions between related proteins. Network nodes represent proteins, edges represent protein–protein interactions, and the line thickness indicates the strength of data support. Four main protein–protein interactions were observed, and Hdac2 (A), Xrcc2-Xrcc3 (B), Uhrf1 (C), and Prkar2b (D) were identified as key proteins in these interactions.