
Figures & data
Figure 1. 1 H NMR spectra of HA, DHA and BHA. Polysaccharides were prepared at a concentration of 15 mg mL– in D2O. 1H NMR spectra of HA, DHA and BHA were recorded at 348 K with a 500 MHz spectrometer. HA: hyaluronic acid; DHA: partially deacetylated HA; BHA: partially butylated HA; GlcA: d-glucuronic acid; GlcNAc: N-acetyl-d-glucosamine; GlcN: d-glucosamine; GlcNBu: N-butyl-d-glucosamine.
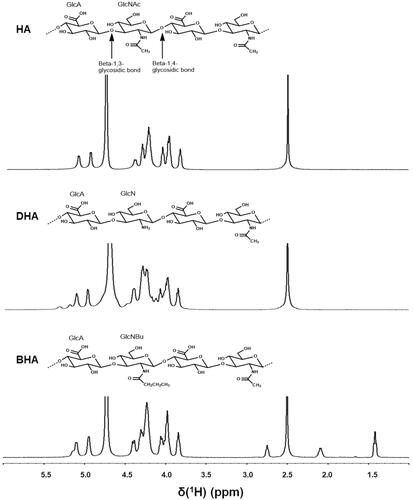
Figure 2. Electrophoretic separation of HA and its derivatives. The HA ladder (standard) has a range of molecular weight of HA from 500 to 30 kDa. The amounts of analytes that were loaded on the gel are as follows: 7.5 μg of native HA; 7.5 μg of DHA; 5 μg of DHA1, prepared via the same method as to prepare DHA but from a different batch; 7.5 μg of AHA, partially deacetylated HA and then reacylated with acetic anhydride; 7.5 µg of BHA; 7.5 μg of BHA1, prepared via the same method as to prepare BHA, but from a different batch.
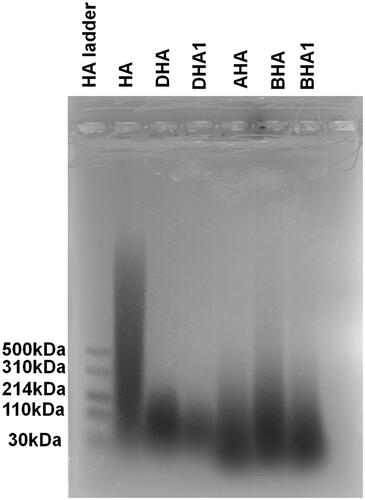
Table 1. The theoretical and observed molecular ion species in HA and HA derivatives along with their relative intensities.
Figure 3. (A) Summary of the protocol for MSU crystal injection and drug administration in rats. COL (0.3 mg/kg/day) was orally administrated; MSU solution (100 μL, 30 mg mL−1) or MSU and BHA (10 or 50 μg) were intra-articular injected at the right ankles. (B) The effects of COL and BHA on the ankle swelling in MSU crystal-injected rats. The % decrease in swelling with time in the normal control group (NC) may be due to the physical damage caused by the needle injection of 0.9% sterile saline. Data are expressed as mean ± S.D. (n = 10) and were analyzed via a one-way ANOVA test followed by post hoc Dunn’s multiple comparison tests. ##p < 0.01 versus control rats, *p < 0.05 and **p < 0.01 versus model rats.
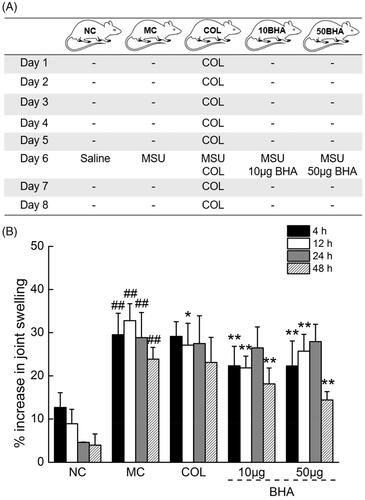
Figure 4. (A) Summary of the protocol for hyperuricemic mice. Yeast extract powder (YEP) (20 g kg−1) was orally administrated; AL (20 mg kg−1) was orally administrated; OXO (300 mg kg−1) or OXO and BHA (10 or 50 μg) were intraperitoneally administrated. (B) The effects of AL and BHA on the serum levels of UA in hyperuricemic mice. (C) The effects of AL and BHA on the XO levels in the liver. Data are expressed as mean ± S.D. (n = 10) and were analyzed via a one-way ANOVA test followed by post hoc Dunn’s multiple comparison tests. #p < 0.05 and ##p < 0.01 versus normal control, *p < 0.05 and **p < 0.01 versus model control.
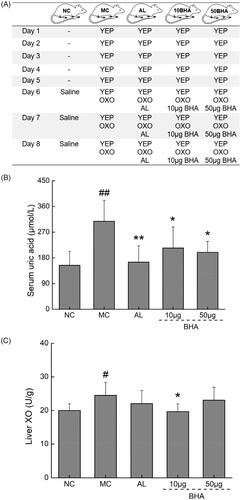
Figure 5. (A) Histopathological assessment of synovium in ankle joints of rats after H&E staining. The right ankles of mice were excised and fixed in 4% paraformaldehyde, and subsequently decalcified using 10% ethylenediaminetetraacetic acid. They were then dehydrated via processing in alcohol/xylene mixtures with different proportions and concentrations. The histological sections were stained with hematoxylin and eosin. The histopathological changes of the joint synovium were assessed for the degree of inflammatory cell infiltrate, by an experienced histopathologist. Microscopy at magnifications of 40×, 100×, 200× and 400× is shown for typical areas for each of the five groups. Normal rats (NC), displayed normal synovium. Increased inflammatory cell infiltration was noted in the synovium of MSU crystal-injected rats (MC). Treatment with COL, and 10 µg of BHA partially prevented the pathological changes seen in the MSU crystal-injected rats. (B) Quantification of the pro-inflammatory cells. Data are expressed as mean ± S.D. (n = 5), ###p < 0.001 relative to NC group (n = 5); *p < 0.05 and ***p < 0.001 relative to MC group.
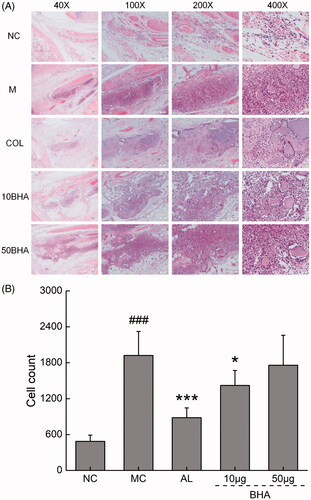
Table 2. The effects of COL and BHA on the pro-inflammatory cytokines in rats with MSU-induced acute gout.
Figure 6. (A) The effects of AL and BHA on the serum level of Cr in hyperuricemic mice. (B) The effects of AL and BHA on the serum level of urea nitrogen in hyperuricemic mice. Data are expressed as mean ± S.D. (n = 10) and were analyzed via a one-way ANOVA test followed by post hoc Dunn’s multiple comparison tests. ##p < 0.01 versus normal control, *p < 0.05 and **p < 0.01 versus model control.
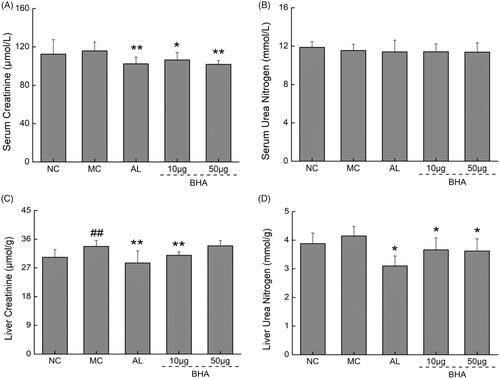
Table 3. The effects of AL and BHA on the oxidative stress factors and renal function in hyperuricemic mice.