Figures & data
Figure 1. H3K18ac expression was reduced by the Ras-ERK1/2 pathway. NCI-H2126 cells were transfected with pEGFP-N1, pEGFP-K-RasWT (RasWT), pEGFP-K-RasG12V/T35S (RasG12V/T35S) plasmids. (A and B) The expression levels of H3K18ac, Ras and the factors of AKT and ERK pathways were then measured by western blots. Data presented as mean + SD, ** p < 0.01 (n = 3).
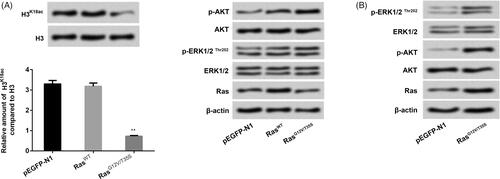
Figure 2. H3K18ac was involved in regulating the functions of Ras-ERK1/2 signaling pathway in lung cancer cell phenotypes. NCI-H2126 cells were transfected with pEGFP-N1, pEGFP-H3, pEGFPH-RasG12V/T35S, or pEGFP-H3K18Q (0.5, 1 and 2 μg) (indicated as GFP, H3, Ras and H3K18Q, respectively) plasmids. (A) Cell viability, (B) numbers of colonies and (C) cell migration were determined by MTT assay, soft agar formation, and Transwell assays, respectively. Data presented as mean + SD, **p < 0.01 (n = 3).
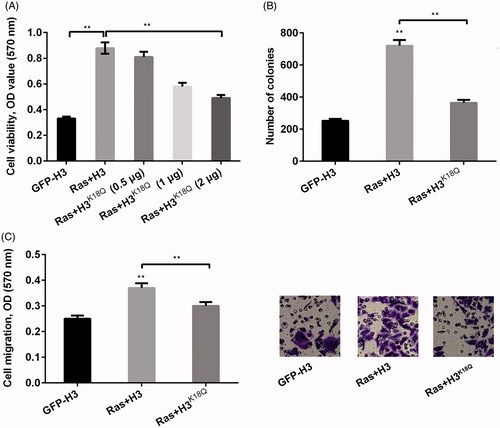
Figure 3. The transcription of Ras-ERK1/2-targeted genes was mediated by H3K18ac. (A) The mRNA levels of ERK1/2 downstream genes (CYR61, IGFBP3, WNT16B, NT5E, GDF15 and CARD16) were tested via RT-PCR after transfection with the corrective plasmids. (B) The transcription of these above-mentioned genes was detected through using ChIP after transfection with the related plasmids. Data presented as mean + SD, **p < 0.01 (n = 3).
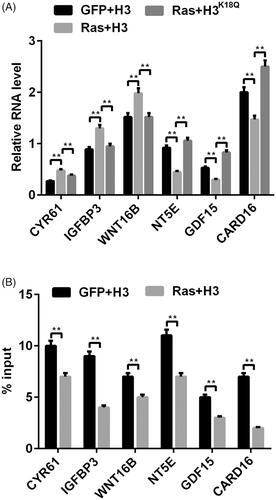
Figure 4. Knockdown of SIRT7 adjusted H3K18ac expression and mediated Ras-ERK1/2-affecting lung cell phenotypes. (A) After si-SIRT7-1 and si-SIRT7-2 plasmids transfection, the expression levels of SIRT7, Ras, AKT and ERK1/2 pathway associated factors were detected through RT-PCR and western blot. NCI-H2126 cells were co-transfected with pEGFP-K-RasG12V/T35S or pEGFP-N1 plasmids and SIRT7-specific siRNA or control siRNA as indicated (Ras, GFP, si-SIRT7-1, si-SIRT7-2, or si-con, respectively). (B) Cell viability, (C) cell migration, (D) cell cycle progression and (E) ERK1/2 downstream genes were examined by MTT assay, Transwell, flow cytometry and RT-PCR assays. Data presented as mean + SD, *p < 0.05, **p < 0.01, ***p < 0.001 (n = 3).
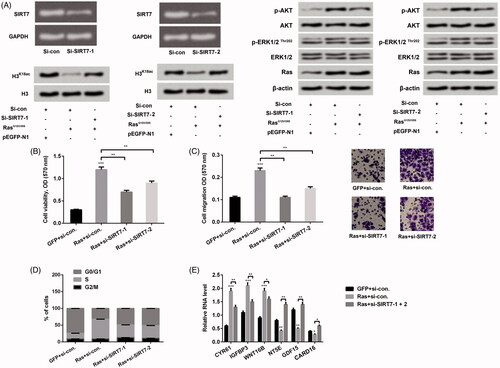
Figure 5. Ras-ERK1/2 activation degraded GCN5 to decline H3K18ac expression. (A) NCI-H2126 cells were transfected with pEGFP-K-RasG12V/T35S, pEGFP-N1, and GCN5-HA or SIRT7-HA plasmids. After transfection, the mRNA levels of GCN5 and SIRT7 were detected by RT-PCR. (B-D) The protein levels of GCN5, SIRT7, H3K18ac, Ras and AKT and ERK1/2 pathways associated factors were analyzed by western blot. (E) The recruitment of GCN5 to the ERK1/2 downstream genes was analyzed via ChIP analysis. (F) After treatment with MG132 (25 μM), the GCN5, Ras, and AKT and ERK1/2 pathways associated factors protein levels were analyzed by western blot with antibodies against HA and GFP. (G-H) After 24, 48, 51, 54, and 60 h transfection without MG132 treatment or 48 h transfection with MG132 treatment (25 μM, 0, 3, 6, and 12 h), the protein levels of H3K18ac, Ras and AKT and ERK1/2 pathways associated factors were analyzed by western blot. Data presented as mean + SD, *p < 0.05, **p < 0.01 (n = 3).
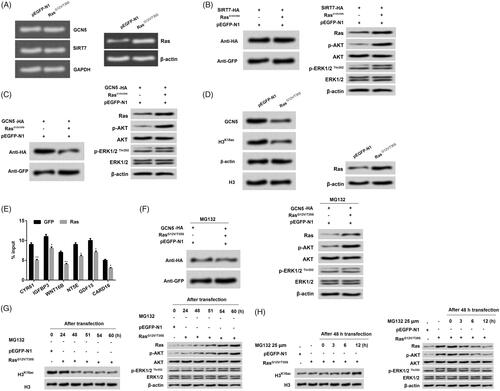
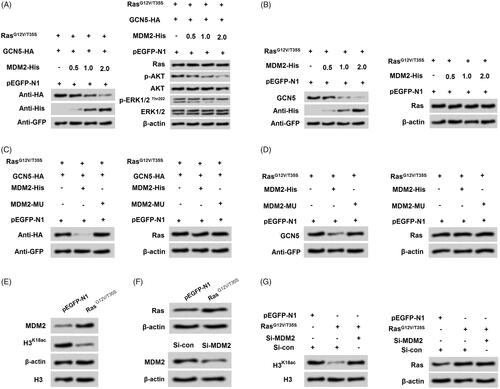
Figure 6. Ras-ERK1/2 pathway-induced degradation of GCN5 was mediated by MDM2. (A-B) NCI-H2126 cells were co-transfected with GCN5-HA, pEGFP-K-RasG12V/T35S, of pEGFP-N1 plasmids and increasing amounts of MDM2-His plasmid (0.5, 1, and 2 μg), the protein levels of GCN5, MDM2, Ras, and AKT and ERK1/2 pathways associated factors were examined by western blot. (C-D) After transfection with a mutation in MDM2 (MDM2-MU), GCN5 and Ras protein levels were detected by western blot. (E and F) After pEGFP-N1, pEGFP-K-RasG12V/T35S or si-MDM2 transfection, MDM2, H3K18ac and Ras protein levels were analyzed via western blot. (G) After co-transfection with pEGFP-K-RasG12V/T35S and MDM2-specific siRNA, H3K18ac and Ras protein levels were determined by western blot.