Figures & data
Figure 1. Analgesic effects of zukamu in mice. Kunming strain mice were treated with different doses of zukamu (1.35, 2.7 and 5.4 g/kg) and positive analgesic control drug GMLG by intragastric administration. The analgesic effects against physical and chemical pain induced by hot stimulation and acetic acid, respectively, were measured by (a) hot plate test and (b) acetic acid writhing test. The data represent the mean ± SD, n = 10 per group. *p< 0.05 vs. control.
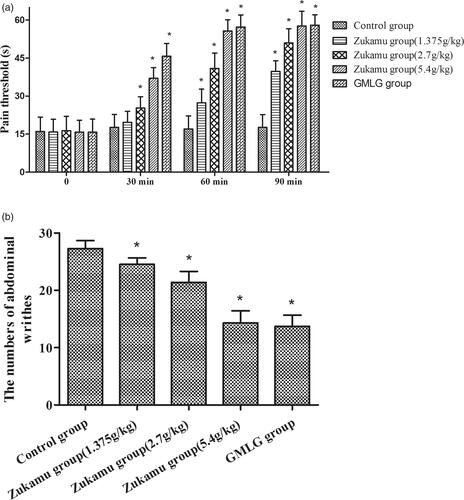
Figure 2. Zukamu decreased the lung W/D ratio of rats with acute lung injury. Sprague–Dawley rats were treated with different doses of zukamu (1.35, 2.7 and 5.4 g/kg) (ig.) and positive anti-inflammatory control drug DEX (ip.) Acute lung injury was induced by LPS injection 60 min after drug administration on the last day. The left lung tissues were collected, the wet and dry weights of the lungs were measured, and the lung W/D ratios were calculated. The data represent the mean ± SD, n = 10 per group. *p< 0.05 vs. control, #p< 0.05 vs. Model.
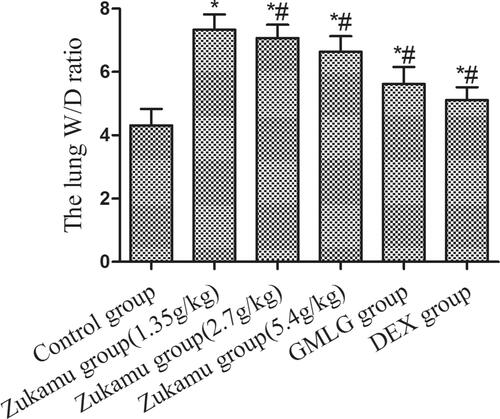
Figure 3. Effect of zukamu on the pathological morphology in rats (200×). Haematoxylin-eosin staining of the pathological morphology of right lung tissues in (a) control rats, (b) model rats, and rats treated by (c) DEX, (d) low-dose zukamu, (e) medium-dose zukamu and (f) high-dose zukamu.
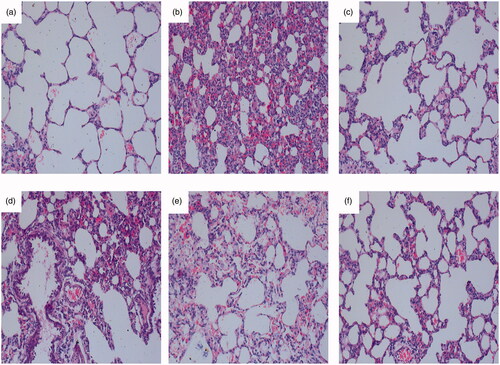
Figure 4. Serum expression of (a) TNF-α, (b) IL-1β, (c) IL-12 and (d) IL-6. The data represent the mean ± SD, n = 5–8 per group. *p< 0.05 vs. control, #p< 0.05 vs. Model.
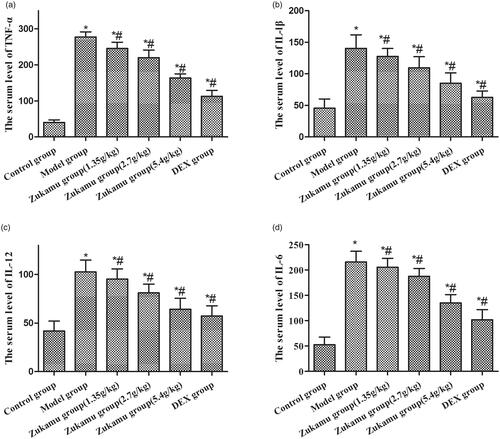
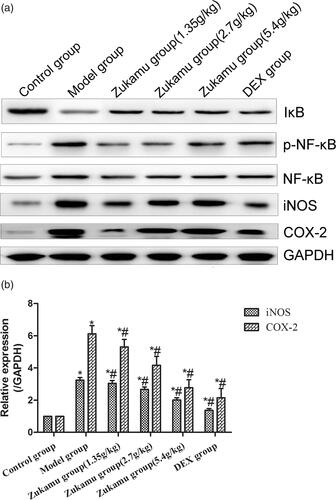
Figure 5. Regulation of NF-κB signalling pathway by zukamu. (a) Expression of proteins related to NF-κB signalling was detected by western blot. (b) mRNA levels of COX-2 and iNOS were evaluated by qRT-PCR. The data represent the mean ± SD, n = 3 per group. *p< 0.05 vs. control, #p< 0.05 vs. Model.