Figures & data
Figure 1. Effects of XNJ on brain infarct area and neurological scores. (A) XNJ obviously improved neurological scores in comparation with the I/R group. Data are represented as mean ± S.E.M. (n = 10). (B) Representive TTC staining section. (C) Quantitative analysis of infarct regions. Brain infarct area was distinctly decreased after XNJ treatment in comparation with the I/R group (n = 3). (***p < 0.001 vs. Sham; #p < 0.05 vs. I/R; ##p < 0.01 vs. I/R; ###p < 0.001 vs. I/R).
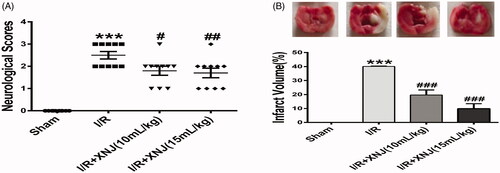
Figure 2. XNJ prevented morphologic injury in cerebral I/R injury rats. (A) Cerebral cortex of I/R brain after 24 h of reperfusion viewed H&E-staining. (B) White matter of I/R brain after 24 h of reperfusion viewed H&E-staining. (C) Hippocampus I/R brain after 24 h of reperfusion viewed H&E-staining. (scale bar = 50 or 20 µm). The black arrow represents the pyknotic nucleus. n = 3 in each group.
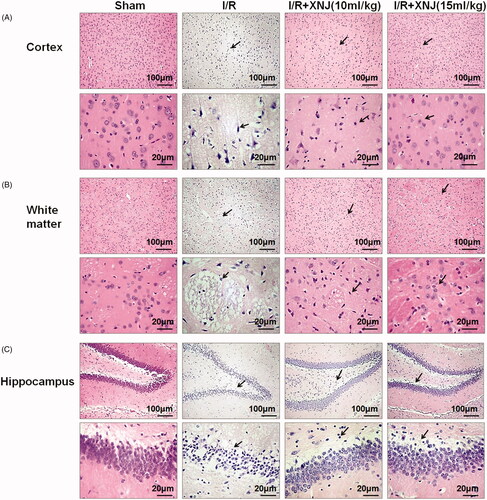
Figure 3. XNJ treatment blocked the expression of inflammatory mediators in cerebral I/R injury in rats. (A) Representative western blots showing protein levels of NF-κB/p65, IκB-α, VCAM-1, ICAM-1, TNF-α, IL-1β and IL-6. Protein levels were standardized to β-actin. Quantification of protein levels were shown in (B, C, D, E, F, G). Data are represented as mean ± S.E.M. (*p < 0.05 vs. Sham; **p < 0.01 vs. Sham; ***p < 0.001 vs. Sham; #p < 0.05 vs. I/R; ##p < 0.01 vs. I/R; ###p < 0.001 vs. I/R). n = 4 in each group.
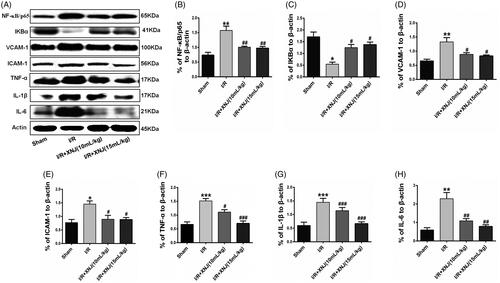
Figure 4. The effects of XNJ on SIRT1 expression and activity in cerebral I/R injury in rats. (A) Representative immunohistochemical staining images of SIRT1; (B) Quantitative analysis of the images showed XNJ increased the SIRT1 expression compared with I/R group; (C) Quantitative analysis of the images showed XNJ increased the SIRT1 expression relative to I/R group. (D)The SIRT1 activity was determined using a SIRT1 fluorometric assay kit. Data are represented as mean ± S.E.M. (*p < 0.05 vs. Sham; **p < 0.01 vs. Sham; ***p < 0.001 vs. Sham; #p < 0.05 vs. I/R; ##p < 0.01 vs. I/R). n = 4 in each group.
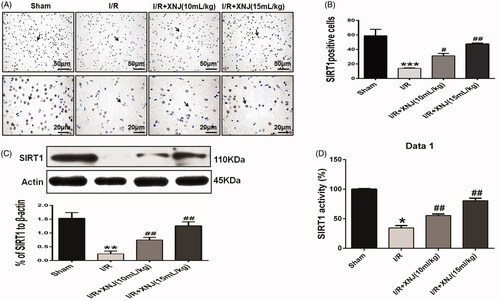
Figure 5. The effects of EX527 on the level of inflammatory mediators in cerebral I/R injury in rats. (A, B) EX527 markedly enhanced NF-κB/p65 activity relative to XNJ groups. (A, C) EX527 obviously decreased IκBα expression relative to XNJ groups. (A, D, E) The level of adhesion molecules ICAM-1 and VCAM-1 were upregulated by EX527 relative to XNJ groups. (A, F, G, H) EX527 also markedly enhanced the level of pro-inflammatory cytokines TNF-α, IL-1β and IL-6 relative to XNJ groups. Data are represented as mean ± S.E.M. (**p < 0.01 vs. Sham; ***p < 0.001 vs. Sham; #p < 0.05 vs. I/R; ##p < 0.01 vs. I/R; ###p < 0.001 vs. I/R; &p < 0.05 vs. I/R + XNJ; &&&p < 0.001 vs. I/R + XNJ). n = 4 in each group.
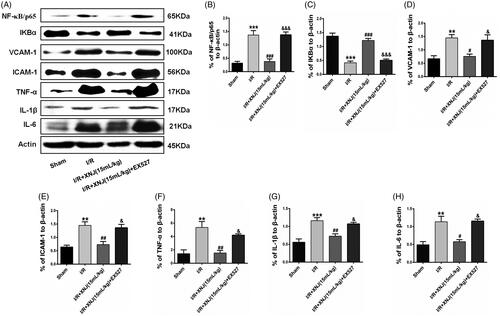
Figure 6. EX527 dramatically blocked the effects of XNJ on the repression of macrophage activation. (A) Representative immunohistochemical staining images of macrophage cells; (B) Quantification of macrophage/microglia cells. (**p < 0.01 vs. sham; ###p < 0.001 vs. I/R; &&p < 0.01 vs. I/R + XNJ). n = 4 in each group.
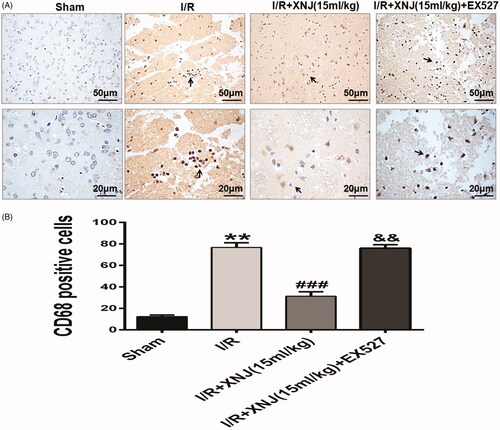
Figure 7. Effects of XNJ on SIRT1 expression in OGD-cultured HBMECs. (A) The protein expression of SIRT1 was analyzed by western blot; (B) SIRT1 was up-regulated in the HBMECs exposed to OGD pre-treated with XNJ by immunofluorescent staining. Positive stainings as shown in green. Scale bars: 50 μm. Data are represented as mean ± S.E.M. (***p < 0.001 vs. CTL; #p < 0.05 vs. OGD; ###p < 0.001 vs. OGD). n = 4 in each group.
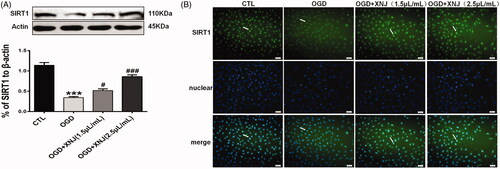
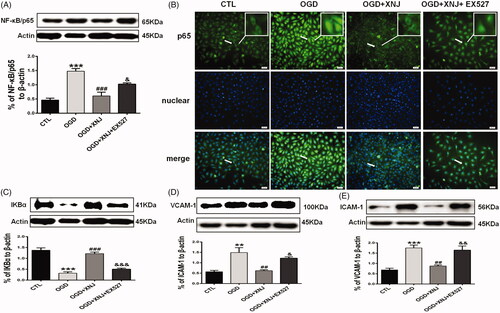
Figure 8. SIRT1 regulated the remission of XNJ on inflammation in HBMECs. (A) EX527 markedly enhanced NF-κB/p65 activity relative to XNJ groups. (B) NF-κB/p65 translocation from cytoplasm to nucleus was detected. (C) IκBα expression was detected by western blot. (D) Adhesion molecules VCAM-1 and ICAM-1 were detected by western blot. Scale bars: 50 μm. Data are represented as mean ± S.E.M. (**p < 0.01 vs. CTL; ***p < 0.001 vs. CTL; ##p < 0.01 vs. OGD; ###p < 0.001 vs. OGD; &p < 0.05 vs. OGD + XNJ; &&p < 0.01 vs. OGD + XNJ; &&&p < 0.001 vs. OGD + XNJ)). n = 4 in each group.