Figures & data
Table 1. Primer Sequences.
Figure 1. Effects of MS and progesterone on depressive-like behaviours in male mice: FST (A), splash test (B) and OFT (horizontal activity: C and vertical activity: D). Values are presented as mean ± S.E.M from eight animals and were analysed using one-way ANOVA followed by Tukey post hoc test. *p < 0.05 and ***p < 0.001 compared to the control group, #p < 0.05, ##p < 0.01 and ###p < 0.001 compared with the salinereceived MS mice.
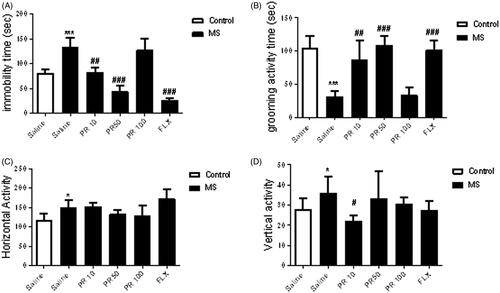
Figure 2. Effects of MS and progestrone on MDA content in the hippocampus. Values are presented as mean ± S.E.M from six samples and were analysed using one-way ANOVA followed by Tukey post hoc test. ***p < 0.001 compared to the control group, #p < 0.05, ##p < 0.01 and ###p < 0.001 compared with the salinetreated MS mice.
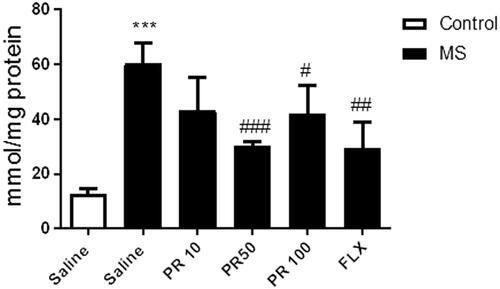
Figure 3. Effects of MS and progestrone on total antioxidant capacity in the hippocampus. Values are presented as mean ± S.E.M from six samples and were analysed using one-way ANOVA followed by Tukey post hoc test. ***p < 0.001 compared to the control group, ##p < 0.01 and ###p < 0.001 compared with the saline-received MS mice.
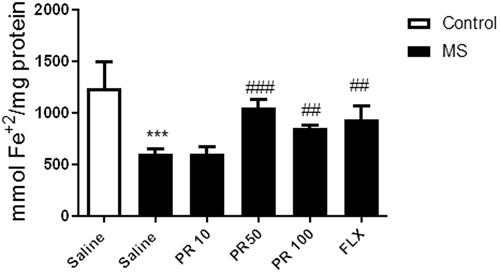
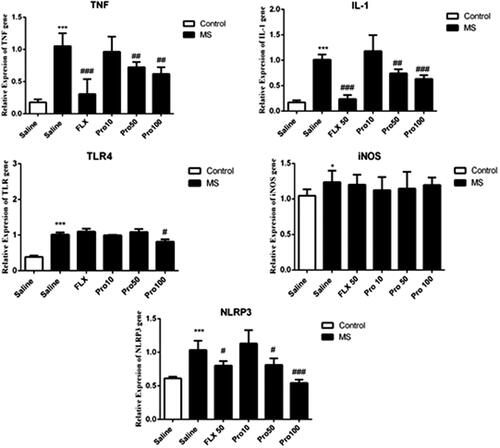
Figure 4. Effects of MS and progestrone on the gene expression of immune-inflammatory genes (Il-1β, TNFα, iNOS, TLR4 and NLRP-3) in the hippocampus. Data are expressed as the mean ± S.E.M from six samples and were analysed by one-way ANOVA. *p < 0.05 and ***p < 0.001 compared to the control group, #p < 0.05, ##p < 0.01 and ###p < 0.001 compared with the saline-received MS mice.