Figures & data
Figure 1. Screening of cells and compounds. (A) mRNA expression of TRPV4 in different types of cells. (B) The protein expression of TRPV4 in melanoma cells compared with epidermal cell, of which A375 was the most significant. (C) Digitalized data from densitometric analysis of the western blots. Values are presented as mean ± SD.
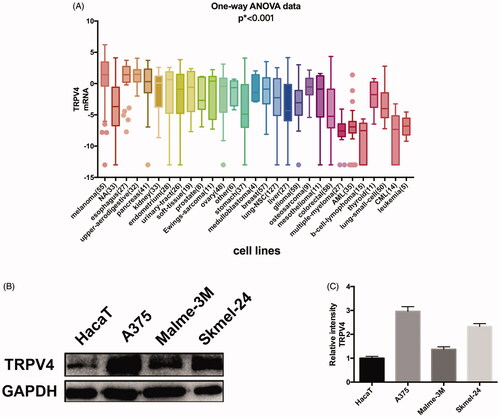
Table 1. Structural similarity between GSK1016790A and ‘hot’ compounds from TCM (similarity > 0.5).
Table 2. Structural similarity between HC-067047 and ‘cold’ compounds from TCM (similarity > 0.5).
Figure 2. Schematic diagram of the temperature measurement experiment and observation of the thermal resistors surface with and without A375 cells growing by SEM. (A) Schematic diagram of the temperature measurement experiment. (B) Thermal resistors surface without cells. (C) Thermal resistors surface with A375 cells growing (100 ×). (D) Thermal resistors surface with A375 cells growing (200 ×).
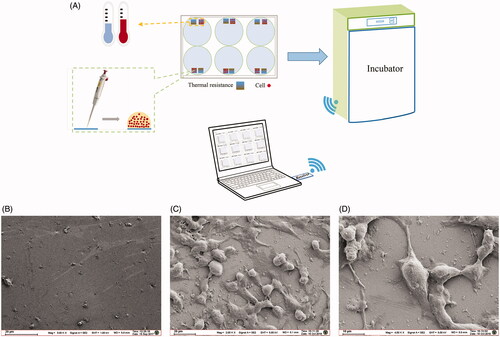
Figure 3. Effects of GSK1016790A and HC-067047 on A375 cell temperature and calcium influx. (A) Effect of GSK1016790A (0.5, 1, 2, 4, 8, 16, 32, and 64 nM) on the proliferation of A375 cells after 24 h intervention. (B) Effect of HC067047 (1, 2, 4, 8, 16, 32, 64, and 128 μM) on the proliferation of A375 cells after 24 h intervention. (C) Median temperature for GSK1016790A, DMSO of 2 μL, DMSO of 10 μL and HC067047 on A375 cells. (D) Temperature changes of A375 cells relative to median temperature for GSK1016790A and HC067047. (E) The local amplification of (D) which shows the dosing details. (F) Statistics of cell temperature changes for GSK1016790A and HC067047 compared to control conditions (p = 0.0002). (G) The calcium influx of A375 cells. The top and bottom is, respectively, the group pre-incubated with DMSO and HC-067047 30 min before stimulated by GSK1016790A; the left of 0 s is the calcium ion level in A375 cells without GSK1016790A, and the right 20 s is the calcium ion level after GSK1016790A was added. (H) Quantitative caption of intracellular calcium ion fluorescence intensity over time in A375 cells pre-incubated with DMSO 30 min before stimulated by GSK1016790A. (I) Quantitative caption of intracellular calcium ion fluorescence intensity over time in A375 cells pre-incubated with HC-067047 30 min before stimulated by GSK1016790A. Values are presented as mean ± SD (*p < 0.05, ***p < 0.005).
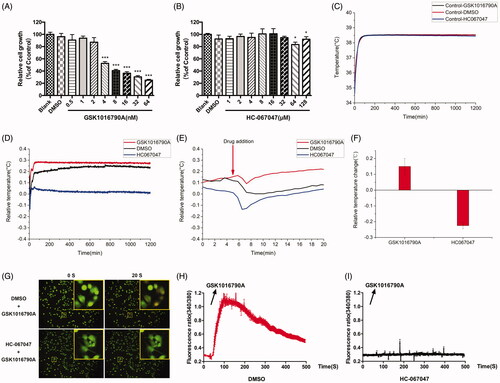
Figure 4. Effects of hypaconitine and baicalin on A375 cell temperature and calcium influx. (A) Effect of hypaconitine (1, 2, 4, 8, 16, 32, 64, and 128 μM) on the proliferation of A375 cells after 24 h intervention. (B) Effect of Baicalin (1, 2, 4, 8, 16, 32, 64, and 128 μM) on the proliferation of A375 cells after 24 h intervention. (C) Median temperature for hypaconitine, baicalin, and DMSO on A375 cells. (D) Temperature changes of A375 cells relative to median temperature for hypaconitine and baicalin. (E) The local amplification of (D) which shows the dosage details. (F) Statistics of cell temperature changes for hypaconitine and baicalin compared to control conditions (p = 0.0006). (G) The calcium influx of A375 cells. The top and middle is respectively the group pre-incubated with DMSO and HC067047 30 min before stimulated by hypaconitine; the bottom is the group pre-incubated with baicalin 30 min before stimulated by GSK1016709A; the left of 0 s was the calcium ion level in A375 cells without agonists, and the right 20 s was the calcium ion level after hypaconitine/GSK1016790A was added. (H) Quantitative caption of intracellular calcium ion fluorescence intensity over time in A375 cells pre-incubated with DMSO/HC067047 30 min before stimulated by hypaconitine. (I) Quantitative caption of intracellular calcium ion fluorescence intensity over time in A375 cells pre-incubated with baicalin 30 min before stimulated by GSK1016790A. Values are presented as mean ± SD (**p < 0.01, ***p < 0.005).
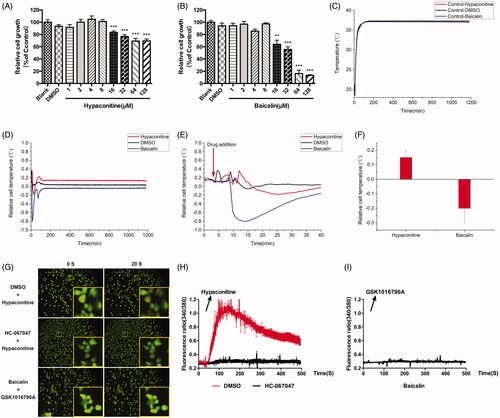
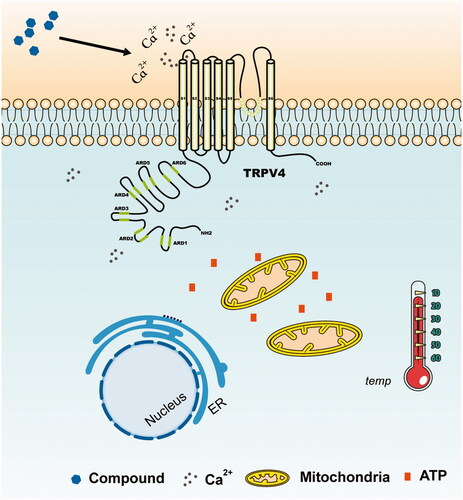
Figure 5. Sketch of temperature change caused by TRPV4. The local inset refers to the locally enlarged display of the graphs. The compounds acting on TRPV4 which has the capability to open the channel can cause extracellular calcium ions to flow in, and the intracellular calcium ion concentration will be significantly increased. An increase in the intracellular calcium ion concentration enhances the energy metabolism level of the cells by affecting mitochondria and some other organelles, thereby eventually raising the cell temperature. However, the opposite effect will occur if the TRPV4 channel is shut down.