Figures & data
Figure 1. The chromatographic profile of Erxian Decoction (EXD); orcinol (1), mangiferin (2), 2, 6-dimethoxybenzoic acid (3), ferulic acid (4), curculigoside (5), berberine (6), epimedin C (7), and rubiadin (8). Peaks (1–8) were assigned based on the UV absorption and retention times of the authentic samples.
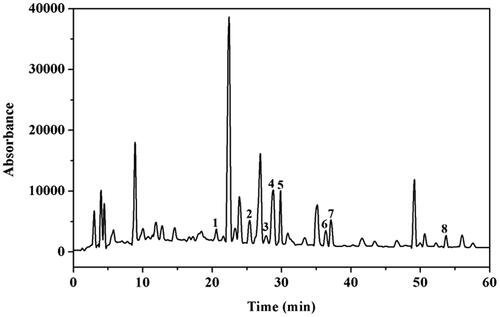
Figure 2. The effects of EXD on the viability of PC12 cells using MTT assay. Data are presented as the mean ± SD, n = 3. *p < 0.05 and **p < 0.01 versus Cort treatment; ##p < 0.01 versus control.
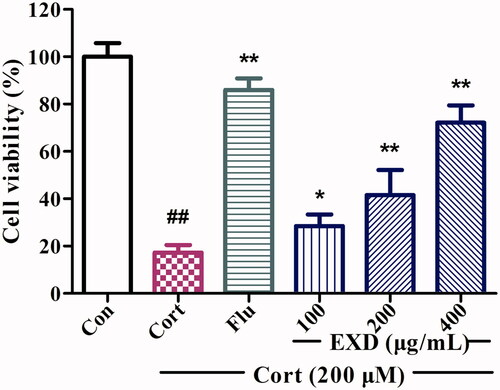
Figure 3. The effect of EXD on morphological changes in PC12 cells. A: Cells observed under an inverted microscope (200×). B: Hoechst 33258 staining for PC12 cells observed using fluorescence microscopy (200×). PC12 cells were pre-treated with fluoxetine or EXD for 1 h, followed by treatment with 200 μM corticosterone for 24 h.
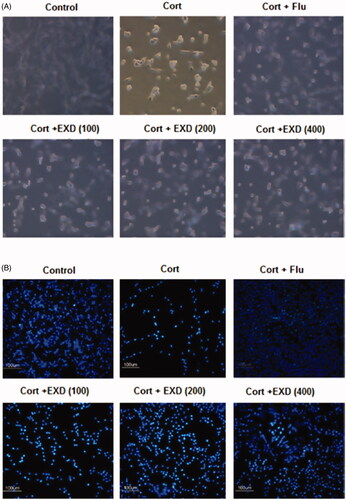
Figure 4. The effects of EXD on LDH release in PC12 cells. Data are presented as the mean ± SD, n = 3. *p < 0.05 and **p < 0.01 versus Cort treatment; ##p < 0.01 versus control.
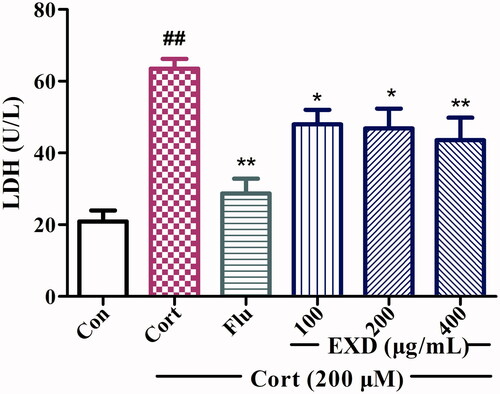
Figure 5. Flow cytometry analysis of apoptosis in PC12 cells measured with Annexin V-FITC and PI double-staining method. A: Representative dot plots of Annexin VFITC/PI staining; B: Bar graph indicating the percentage of apoptotic PC12 cells. Data are presented as the mean ± SD, n = 3. *p < 0.05 and **p < 0.01 versus Cort treatment; ##p < 0.01 versus control.
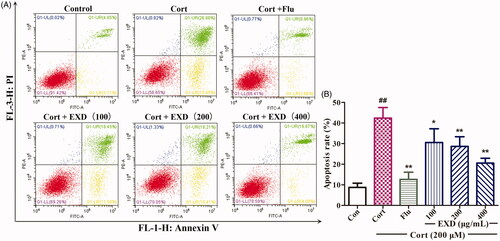
Figure 6. The expression of apoptosis-related proteins in corticosterone-treated PC12 cells. A: Western blotting analysis of Bcl-2, Bax, cleaved caspase-3, and caspase-8 using β-actin as a control; B: Densitometric quantification of the ratio of Bcl-2 to β-actin; C: Densitometric quantification of the ratio of Bax to β-actin; D: Densitometric quantification of the ratio of cleaved caspase-3 to β-actin; E: Densitometric quantification of the ratio of caspase-8 to β-actin; Data are presented as the mean ± SD, n = 3. *p < 0.05, **p < 0.01, and ***p < 0.001 versus Cort treatment; ###p < 0.001 versus control.
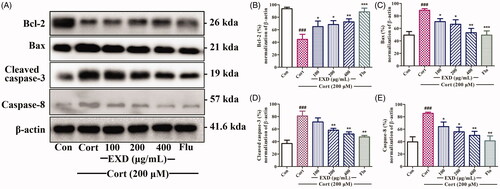
Figure 7. Effects of EXD on the immobility time in the despair model. A: Experimental schedule; B: FST; C: TST. Data are presented as the mean ± SD (n = 8). #p < 0.05 and ##p < 0.01 versus control group.
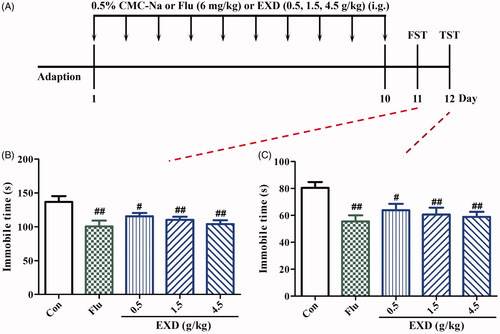
Figure 8. Antidepressant-like effects of EXD on mice in the reserpine-induced depression model. A: Experimental schedule; B: Antagonistic effect of EXD on reserpine-induced hypothermia in mice; C: Antagonistic effect of EXD on reserpine-induced palpebral ptosis in mice; D: Antagonistic effect of EXD on reserpine-induced akinesia in mice; E: Effect of EXD on immobility time in the FST of reserpine-treated mice; F: Effect of EXD on immobility time in the TST of reserpine-treated mice. Data are presented as the mean ± SD (n = 8). *p < 0.05 and **p < 0.01 versus Res treatment; ##p < 0.01 versus control.
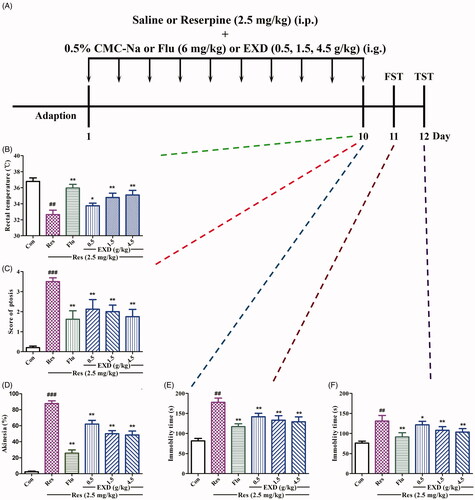
Figure 9. The expression of apoptotic proteins in the hippocampus in both the behavioural despair model and the reserpine-induced pharmacological model. A: Determining the levels of Bcl-2, Bax, cleaved caspase-3, caspase-8, and β-actin in the hippocampus of mice in the despair model with Western blotting. B–E: Ratios of Bcl-2, Bax, cleaved caspase-3, and caspase-8 to β-actin in the hippocampus of mice in the despair model. F: Determining the levels of Bcl-2, Bax, cleaved caspase-3, caspase-8, and β-actin in the hippocampus of mice in the reserpine-induced pharmacological model with Western blotting. G–J: Ratios of Bcl-2, Bax, cleaved caspase-3 and caspase-8 to β-actin in the hippocampus of mice in the reserpine-induced pharmacological model. Data are presented as the mean ± SD, n = 3. *p < 0.05, **p < 0.01, and ***p < 0.001 versus Cort treatment; ##p < 0.01 and ###p < 0.001 versus control.
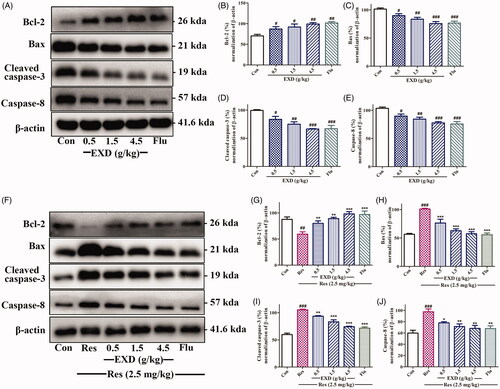
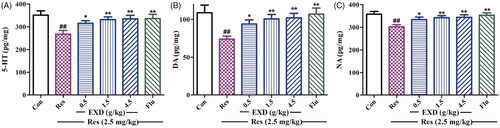
Figure 10. Effects of EXD on neurotransmitter levels in the hypothalamus of mice in the reserpine-induced pharmacological model. A: 5-HT levels in the hypothalamus; B: DA levels in the hypothalamus; C: NA levels in the hypothalamus. Data are presented as the mean ± SD (n = 8). *p < 0.05 and **p < 0.01 versus Res treatment; ##p < 0.01 versus control.