Figures & data
Figure 1. Chemical structure and cytotoxicity of palmatine. Chemical structure of palmatine (A). Cytotoxicities of the palmatine was measured by MTT assay, and calculated by the inhibitory rate of cell proliferation (n = 8) (B).
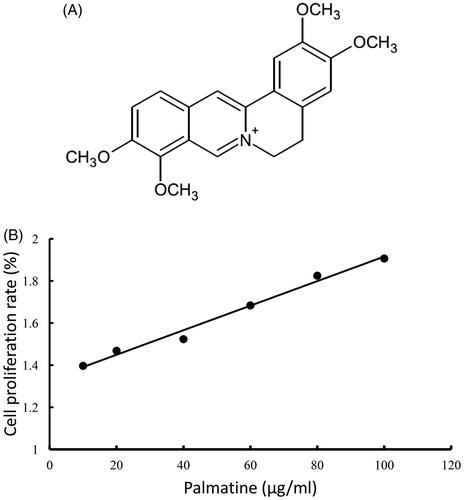
Figure 2. Venn diagram showing the distribution of DEPs from the LPS-stimulated group and palmatine-treated group. The blue oval represents upregulated proteins in the LPS-stimulated group (LPS Up), the yellow oval represents downregulated proteins in the LPS-stimulated group (LPS Down), the green oval represents upregulated proteins in the palmatine-treated group (PMT Up), and the red oval represents downregulated proteins in the palmatine-treated group (PMT Down). Overlap between ovals indicates the number of proteins common to different groups.
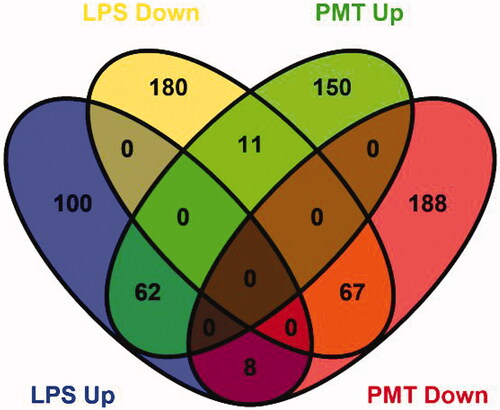
Figure 3. Clustering of differentially expressed proteins. The log2-transformed ratios are shown as a gradient from red to green in which red indicates higher expression and green indicates lower expression. A–I are different clustered subfamilies.
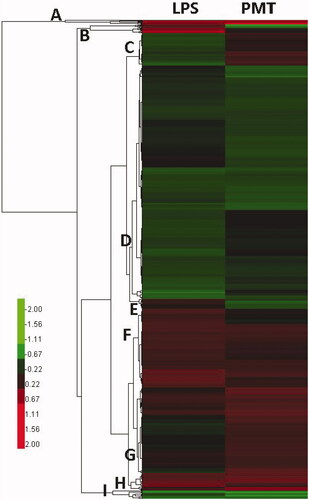
Figure 4. Classification of the top 5 DEPs based on their functional annotation using gene ontology enrichment analysis. (A) LPS-stimulated group and (B) palmatine-treated group. BP: biological process; CC: cellular component; MF: molecular function. Vertical coordinates indicate different functional annotations, and the abscissas indicate the percentage of proteins enriched in the corresponding annotation among all DEPs.
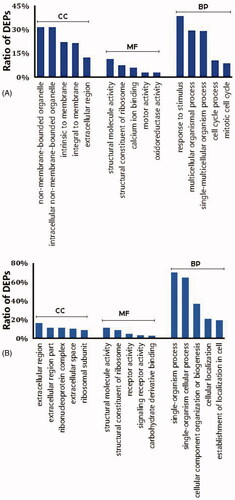
Figure 5. Pathway enrichment analysis of DEPs from the LPS-stimulated group (A) and palmatine-treated group (B).
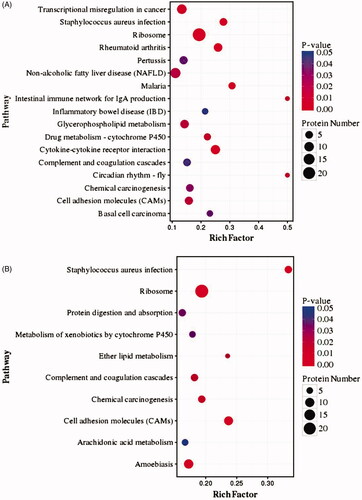
Figure 6. Clustering heat map of cellular adhesion molecules.
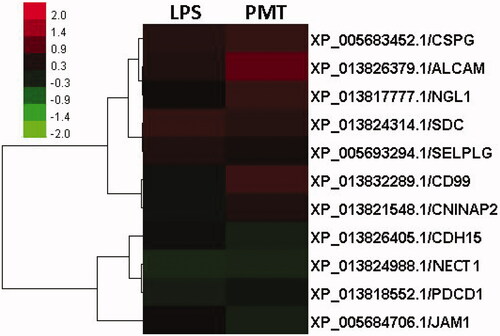
Figure 7. Fold change in the gene expression of CDH5, NECT1 and JAM1 in cells treated with LPS or LPS + palmatine. *p < 0.05.
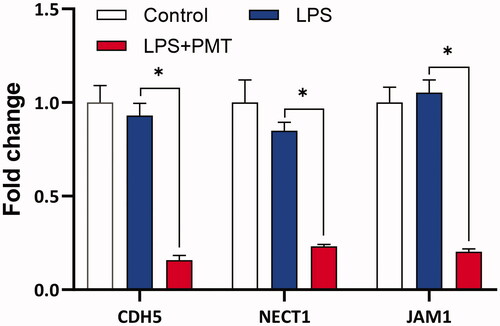
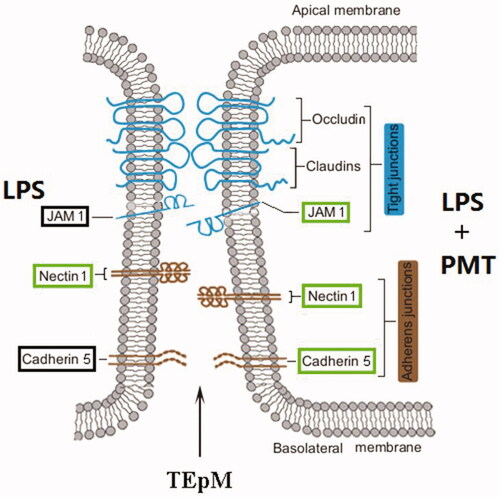
Figure 8. Model of interepithelial junction breakdown by palmatine. The JAM1, nectin 1 and cadherin 5 proteins outlined in green were downregulated after treatment with palmatine in a model of LPS-stimulated cell inflammation.