Figures & data
Figure 1. The effects of METH on neurons and axons. (A) Glees silver staining revealed the morphological changes of axons in the striatum. (B) HE staining showed the pathological changes in the striatum, hippocampus, and nucleus accumbens.
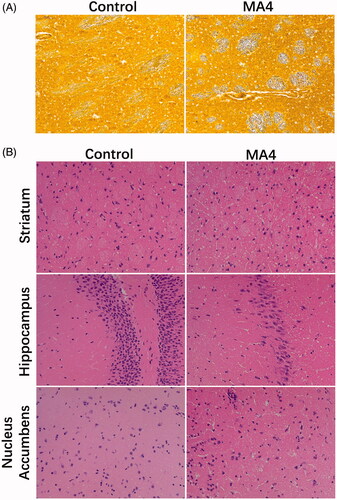
Table 1. The residence time in CPP test.
Figure 2. The effects of METH on neuron differentiation by immunofluorescence. The NSE positive cells decreased (A) while GFAP positive cells (B) increased in the striatum, hippocampus, and NAc after METH treatment.
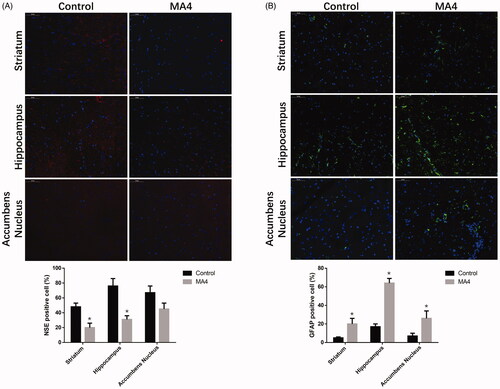
Figure 3. Screening of differentially expressed miRNAs in rat NAc after METH treatment. (A) The volcano map of the differential miRNAs. The abscissa represents the fold change of miRNA expression, and the ordinate represents the statistical significance of the change in miRNA expression. The scatter points represent individual miRNAs. (B) Differential miRNA clustering map.
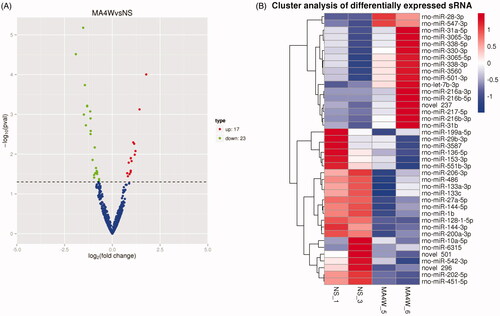
Figure 4. Validation of the differential miRNAs by qPCR. The top up-regulated and downregulated miRNAs in sequencing were measured in the NAc samples with or without METH treatment. Compared with the NC group, *p < 0.05.
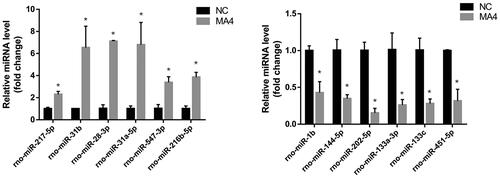
Figure 5. Enrichment analysis of target genes of differential miRNA. (A) GO enrichment analysis of the target genes of differentially expressed miRNAs. The three categories from left to right are biological processes, cellular components and molecular functions. (B) KEGG enrichment analysis of candidate target genes. The ordinate represents the pathway name, and the abscissa represents the rich factor. The size of the points indicates the number of the genes in the pathway.
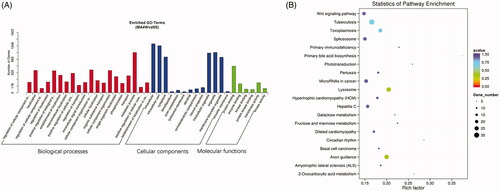
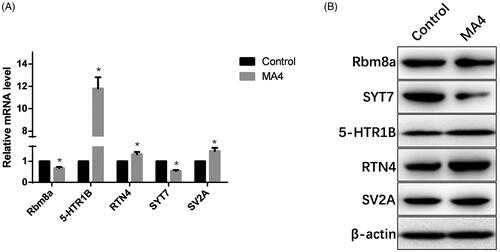
Figure 6. Validation of several targets of the differential miRNAs. (A) Transcription levels of Rbm8a, SYT7, HTR1B, RTN4, and SV2A were measured by qPCR. (B) Protein levels of Rbm8a, SYT7, HTR1B, RTN4, and SV2A were determined by western blotting.