Figures & data
Figure 1. Chemical structures of the three major constituents in the flavonoid fraction. (A) Galangin: 3, 5, 7-trihydroxyflavone; 3-methyl Galangin: 5, 7-Dihydroxy-3-methoxyflavone; Kaempferide: 3, 5, 7-trihydroxy-4-methoxyfla-vone. (B) UHPLC-DAD-MS of F-AOH (1. Kaempferide; 2. 3-methyl Galangin; 3. Galangin).
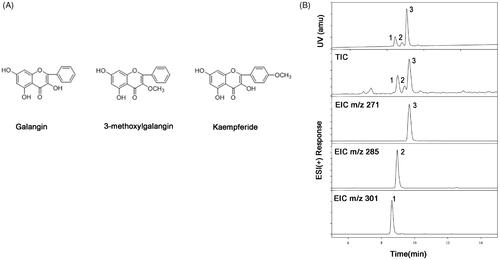
Figure 2. General evaluation of gastric tissue (A) Effects of F-AOH on ethanol-induced gastric mucosal injury. (a) Normal; (b) Ran:100 mg/kg; (c) Ethanol; (d) F-AOH (31.7 mg/kg); (e) F-AOH (63.4 mg/kg); (f) F-AOH (126.8 mg/kg). (B) Ulcer injury index in each group. Values are expressed as means ± standard deviation (n = 8). *p < 0.05, compared with normal group; #p < 0.05 and ##p < 0.01, compared with ethanol group. (C) Percentage of treatments group inhibition. *p < 0.05 compared with Ran group; ##p < 0.01 compared with ethanol group.
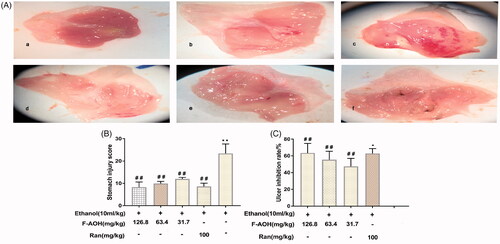
Figure 3. Histological evaluation of F-AOH on ethanol-induced gastric ulcer (H&E staining (magnification: ×400)) (A) Normal; (B) Ethanol; (C) Ran (100 mg/kg); (D) F-AOH (31.7 mg/kg); (E) F-AOH (63.4 mg/kg); (F) F-AOH (126.8 mg/kg).
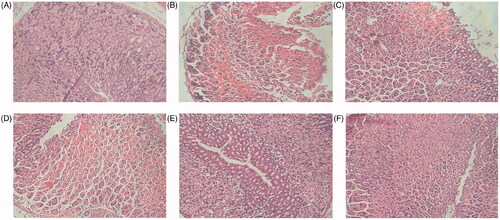
Figure 4. Effects of F-AOH on inflammatory factors in mice (A–C) and GES-1 cells (D–F). Values are expressed as means ± standard deviation (n = 6). *p < 0.05 and **p < 0.01 compared with normal group; #p < 0.05 and ##p < 0.01 compared with ethanol group.
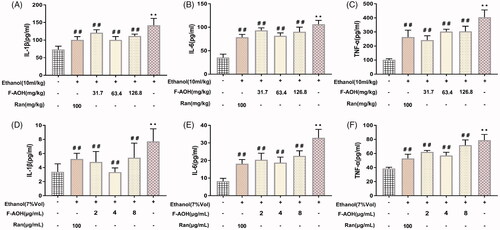
Figure 5. Effect of F-AOH on the levels of PGE2, MTL, GAS, NO and on the activities of iNOS and COX-2 (A–B) Effects of F-AOH on the activities of iNOS and COX-2. (C–F) Effects of F-AOH on the Levels of PGE2, NO, MTL, and GAS. Values are expressed as means ± standard deviation (n = 6). **p < 0.01 compared with normal group; #p < 0.05 and ##p < 0.01 compared with ethanol group.
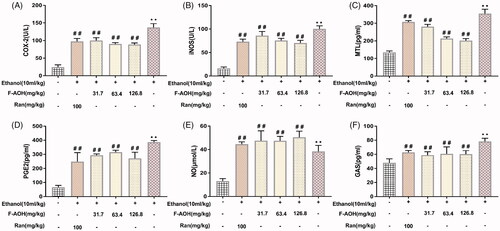
Figure 6. Defensive effects of F-AOH. (A) IC50 of F-AOH on the viability of GES-1 cells was examined. (B) Various concentrations of F-AOH (0, 1, 2, 8, and 16 μg/mL) were used to detect their effects on cell viability. (C) Various concentrations of F-AOH were used to attenuate ethanol-induced inhibition of cell viability. Values are expressed as means ± standard deviation (n = 6). *p < 0.05 compared with normal group; #p < 0.05 and ##p < 0.01 compared with ethanol group.
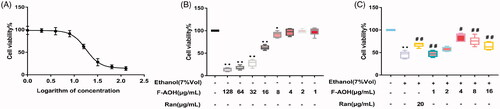
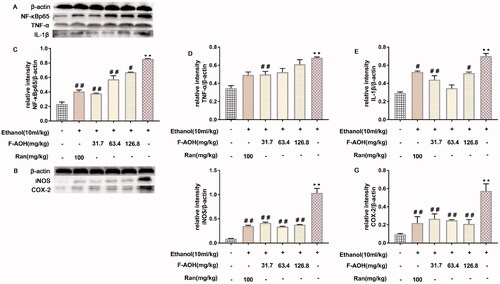
Figure 7. NF-κBp65, COX-2, TNF-α, IL-1β and iNOS protein expression levels (A-B) Effects of F-AOH on the protein expression of NF-κBp65, TNF-α, IL-1β, COX-2, and iNOS in gastric tissues. (C–G) Quantification of the relative protein levels of NF-κBp65, TNF-ℵ, IL-1β, COX-2, and iNOS. **p < 0.01 compared with ethanol group; #p < 0.05 and ##p < 0.01 compared with ethanol group.