Figures & data
Table 1. Primer sequences used for quantitative real-time PCR.
Figure 1. Cytotoxicity of ACR on MH7A cells. MH7A cells were treated with different concentrations of ACR (0.1, 0.2, 0.4, 0.8, 1.0 and 2.0 mg/mL) for 24 h, and cell viability was measured by CCK-8 assay. ACR: an aqueous extract of Cinnamomi ramulus.
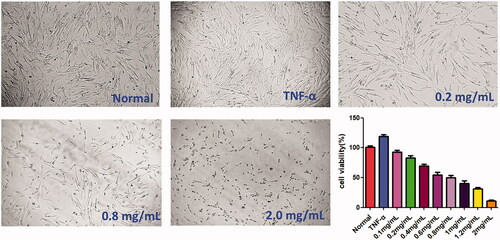
Figure 2. Colony formation assays. Equal numbers of MH7A cells were plated and treated with various concentrations of ACR for 10 days. The number of colony formation was counted in a random microscopic field. Data are expressed as mean ± SD (n = 3), ***p < 0.001, vs. TNF-α group. ACR: an aqueous extract of Cinnamomi ramulus.
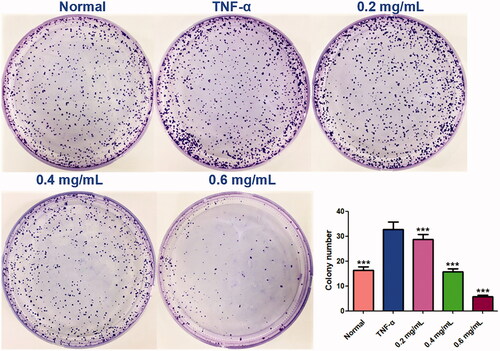
Figure 3. Effect of ACR on apoptosis of MH7A cells. MH7A cells were treated with ACR (0.4, 0.8, 1.2 mg/mL) for 24 h, followed by assessment of apoptosis by flow cytometric analysis. Data are expressed as mean ± SD (n = 3), **p < 0.01, ***p < 0.001, vs. TNF-α group. ACR: an aqueous extract of Cinnamomi ramulus.
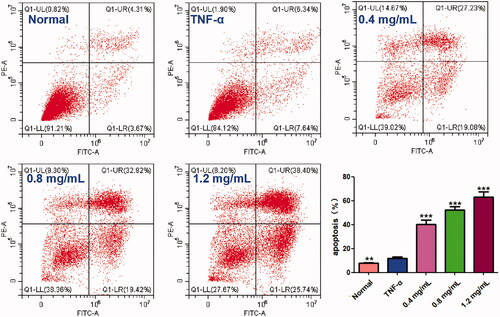
Figure 4. ACR induces apoptosis in MH7A cells. MH7A cells were treated with ACR (0.4, 0.8, 1.2 mg/mL) for 24 h, followed by assessment of apoptosis under laser scanning confocal microscope. ACR: an aqueous extract of Cinnamomi ramulus.
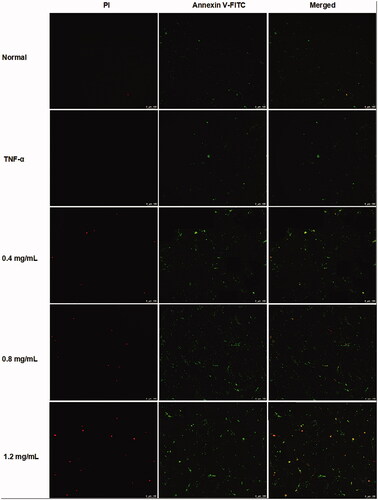
Figure 5. Results of the western blotting assays. Western blot analysis was applied to detect the protein level of C-caspase-3, Bax, Bcl-2, cyclin B1 and CDC2 in MH7A treated with ACR (0.2, 0.4, 0.6 mg/mL) for 24 h. β-Actin was used as the sample loading control, Data are expressed as mean ± SD (n = 3), **p < 0.01,***p < 0.001, vs. TNF-α group. ACR: an aqueous extract of Cinnamomi ramulus.
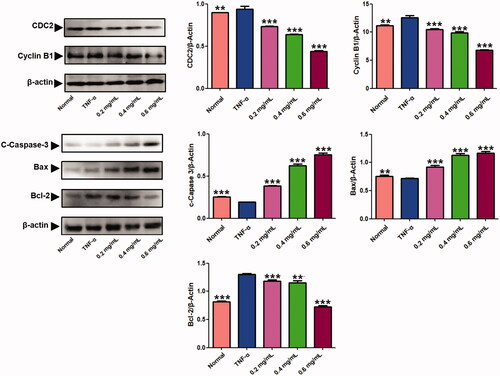
Figure 6. Effect of ACR on the cell cycle in MH7A cells. Flow cytometry was used to assess the cell cycle rate of MH7A cells treated with various concentrations of ACR (0.2, 0.4, 0.6 mg/mL). Histogram represented the statistical analysis of the relative expression level of G2/M related proteins. Data are expressed as mean ± SD (n = 3). ACR: an aqueous extract of Cinnamomi ramulus.
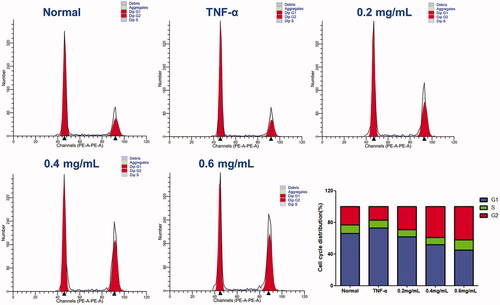
Figure 7. Results of the RT-PCR analysis on P53, P21, CDK4 and cyclin D. Quantitative real-time PCR was performed as described in the Materials and methods. Data are expressed as mean ± SD (n = 3), **p < 0.01, ***p < 0.001, vs. TNF-α group. ACR: an aqueous extract of Cinnamomi ramulus.
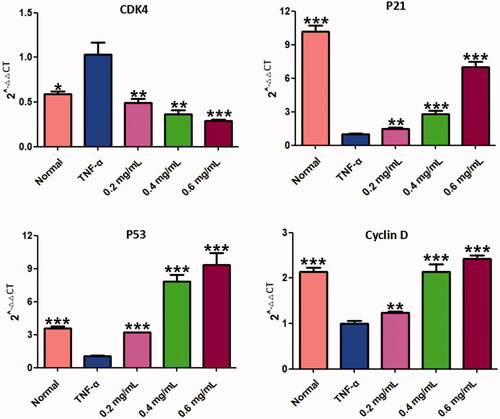
Figure 8. Effects of ACR on migration ability of MH7A cells in wound healing test (A) and transwell migration assay (B) of MH7A cells (200×). Data are expressed as mean ± SD (n = 3), **p < 0.01, ***p < 0.001, vs. TNF-α group. ACR: an aqueous extract of Cinnamomi ramulus.
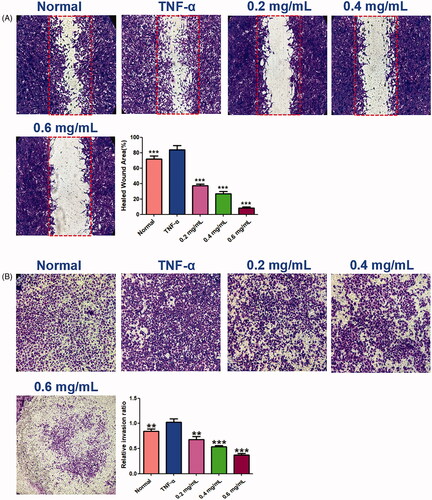
Figure 9. ACR suppresses the invasion ability of MH7A cells. Cell invasion abilities were detected by Matrigel Transwell assay. Cinnamomi ramulus reduced the invasion of MH7A cells in dose-depended manner as demonstrated by representative microscope graphs (200×). Data are expressed as mean ± SD (n = 3), **p < 0.01, ***p < 0.001, vs. TNF-α group. ACR: an aqueous extract of Cinnamomi ramulus.
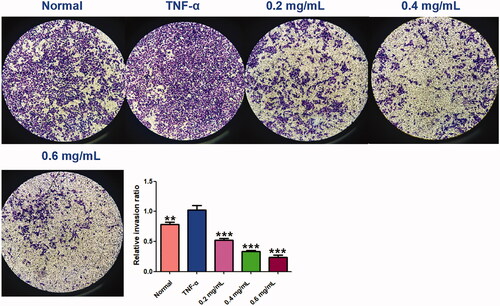
Figure 10. ACR suppresses the expression of MMPs. The mRNA levels of MMP-1, -2 and -3 were determined by using Quantitative real-time PCR (q-PCR). Data are expressed as mean ± SD (n = 3), **p < 0.01, ***p < 0.001, vs. TNF-α group. ACR: an aqueous extract of Cinnamomi ramulus.
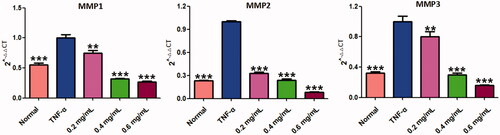
Figure 11. Result of the UPLC-QE-MS/MS assays of ACR. The MS total ion chromatograms (TIC) of ACR and chemical structures of identified compounds in ACR. ACR: an aqueous extract of Cinnamomi ramulus.
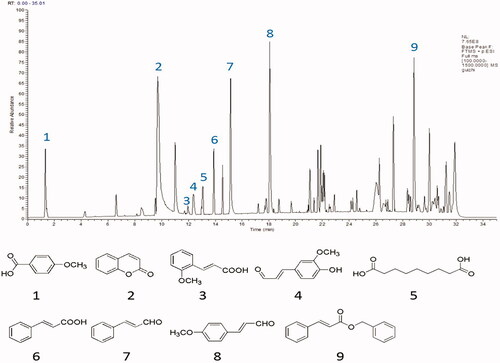
Table 2. Chemical constituents identified from ACR.
Figure 12. The represented results for the proposed action mode of molecular docking. Molecular docking analyses of benzyl cinnamate (compound 9) to the binding site of human and Bcl-2 (A), caspase 3 (B), MMP3 (C), CDC2 (D), cyclin D (E), cyclin B1 (F), P21 (G), CDK4 (H) and P53 (I) proteins.
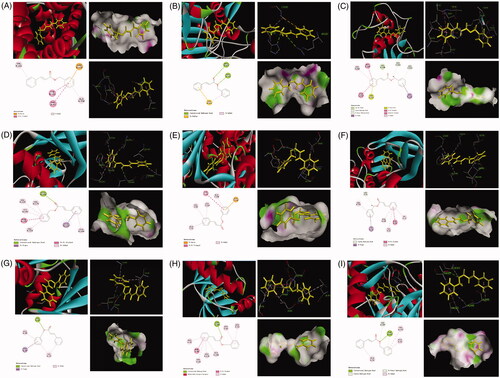
Table 3. Information of the 9 potential target proteins investigated in the present study.
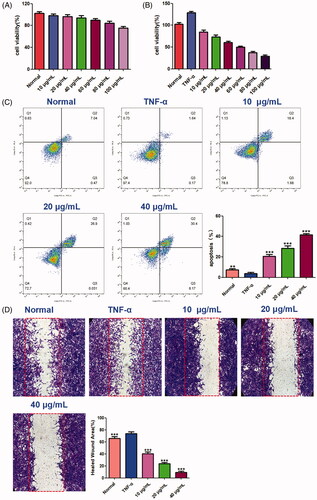
Figure 13. The effects of benzyl cinnamate on the proliferation, cell migration and apoptosis of MH7A cells. (A) HFLS and (B) MH7A cells were treated with different concentrations of benzyl cinnamate (10-100 µg/mL) for 24 h for the CCK-8 assays; (C) MH7A cells were treated with different concentrations of benzyl cinnamate (10, 20, 40 µg/mL) for 24 h, and the apoptotic cells were detected by Annexin V/PI assays; (D) MH7A cells were incubated with benzyl cinnamate (10, 20, 40 µg/mL) for 24 h for the cell migration assay. Data are expressed as mean ± SD (n = 3), **p < 0.01, ***p < 0.001, vs. TNF-α group.