Figures & data
Figure 1. Chemical structure of wogonoside.
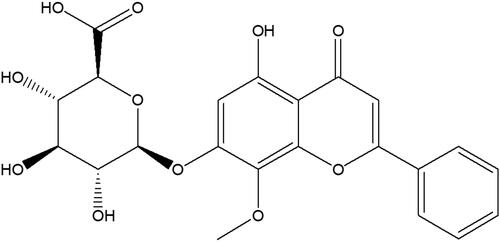
Figure 2. Effects of wogonoside on the body mass (a), liver mass (b), liver index (c) and the serum AST (d) and ALT (e) activities in NAFLD mice. Values are expressed as mean ± SD, n= 10. Compared with the control group: **p< 0.01; Compared with NAFLD group: ##p< 0.01.
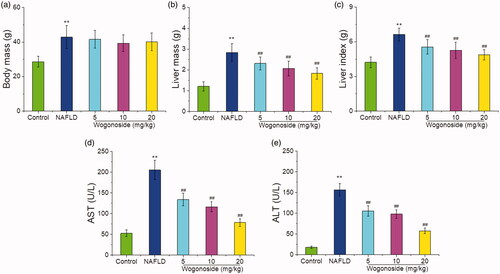
Figure 3. Effects of wogonoside on the pathological morphology of liver tissue in NAFLD mice (HE, ×200).
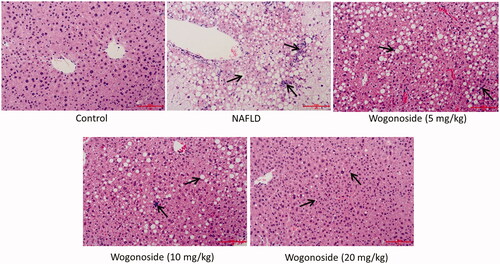
Figure 4. Effects of wogonoside on the serum HDL (a), LDL (b), TG (c) and TC (d) contents in NAFLD mice. Values are expressed as mean ± SD, n= 10. Compared with the control group: **p< 0.01; Compared with NAFLD group: #p< 0.05, ##p< 0.01.
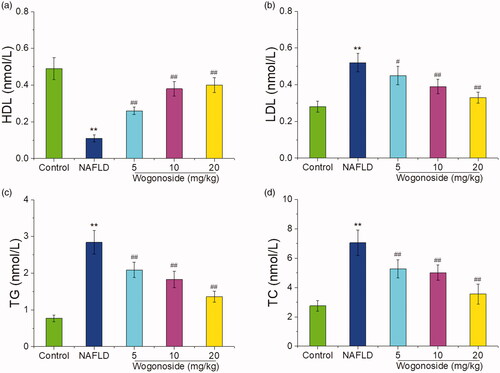
Figure 5. Effects of wogonoside on the inflammatory response of liver tissue in NAFLD mice. (a) IL-2 levels; (b) IL-6 levels; (c) TNF-α levels; (d) Western blot analysis; (e) protein relative expression of NF-κB p65; (f) protein relative expression of IκBα. Values are expressed as mean ± SD, n= 10. Compared with the control group: **p< 0.01; Compared with NAFLD group: ##p< 0.01.
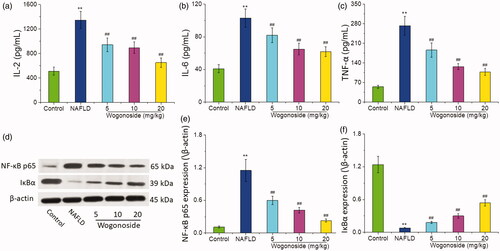
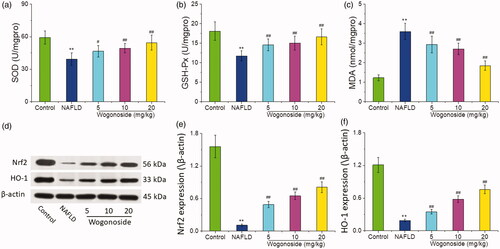
Figure 6. Effect of wogonoside on the oxidative stress level of liver tissue in NAFLD mice. (a) SOD activities; (b) GSH-Px activities; (c) MDA levels; (d) Western blot analysis; (e) protein relative expression of Nrf2; (f) protein relative expression of HO-1. Values are expressed as mean ± SD, n= 10. Compared with the control group: **p< 0.01; compared with NAFLD group: #p < 0.05, ##p < 0.01.