Figures & data
Figure 1. α-Hederin inhibits proliferation of human lung cancer cells. (a) Chemical structure of α-Hederin. (b) Effect of α-hederin on the viability of human lung cancer cells. A549, NCI-H460, and NCI-H292 cells were treated with α-hederin for 48 h. CCK8 assay was performed to analyse cell viability. Results are normalized to PBS controls. (c) Effect of α-Hederin on the viability of non-small cell lung cancer A549 cells. Colony formation of A549 cells treated with α-hederin for 48 h, cultured by DMEM for 10 days, and stained with crystal violet. **p < 0.01 as compared to the 0 μM group. Mean ± S.E.M. n = 3.
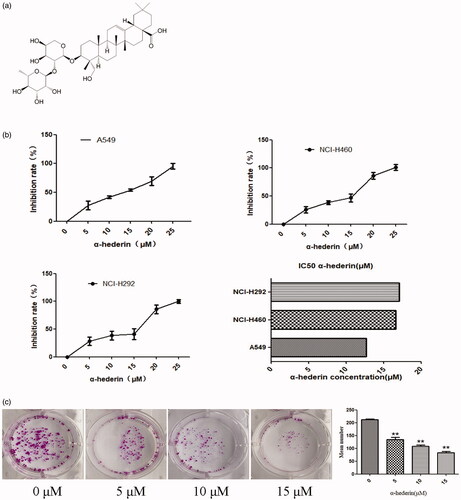
Figure 2. α-Hederin dramatically inhibits aerobic glycolysis in A549 cancer cells. Glucose uptake, lactate generation, and intracellular ATP levels in A549 cells in response to α-hederin treatment for 48 h. The concentration of 2-DG was 8 mM. *p < 0.05, **p < 0.01 as compared to the control group. Mean ± S.E.M. n = 3.
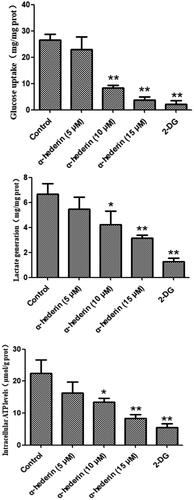
Figure 3. α-Hederin inhibits glycolytic related proteins in human non-small cell lung cancer A549 cells. A549 cells were treated with α-hederin for 24 h. Expression of GLUT1, HK2, PKM2, LDHA and MCT4 was detected by Western blot.
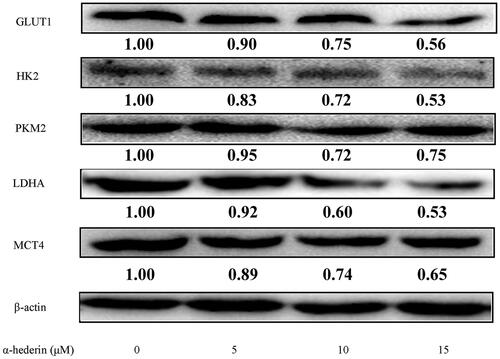
Figure 4. α-Hederin reduces glycolytic levels by inhibiting c-Myc and HIF-1α in human non-small cell lung cancer A549 cells. A549 cells were treated with α-hederin for 24 h. Expression of c-Myc, Akt, HIF-1α, and p53 was detected by western blots.
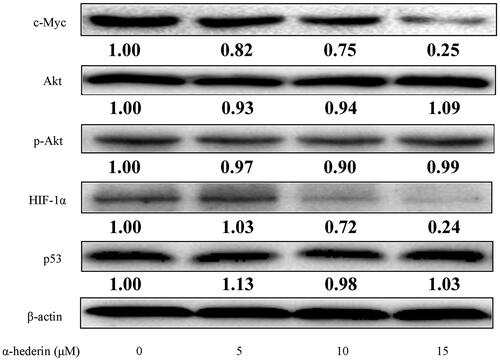
Figure 5. α-Hederin inhibits c-Myc and HIF -1α by activating expression of SIRT6. (a) A549 cells were treated with α-hederin for 24 h. Expression of SIRT6 was detected by western blot. (b) A549 cells were treated with α-hederin or SIRT6 inhibitor OSS_128167 for 24 h. Expression of c-Myc and HIF-1α was detected by western blots.
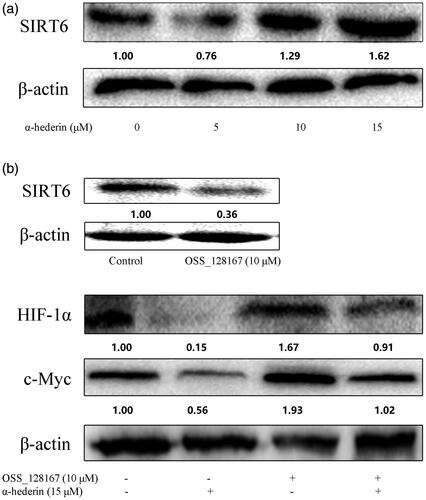
Figure 6. Effect of α-hederin combined with SIRT6 inhibitor OSS_128167 on the viability of A549 cells. Cells were treated with α-hederin for 48 h. CCK8 assay was performed to analyse cell viability. Results are normalized to PBS controls.
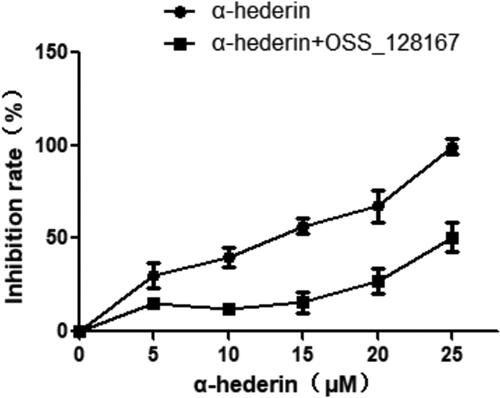
Figure 7. α-Hederin inhibits orthotopic non-small cell lung cancer growth in vivo. *p < 0.05, **p < 0.01 as compared to the Normal control group. Mean ± S.E.M. n = 10.
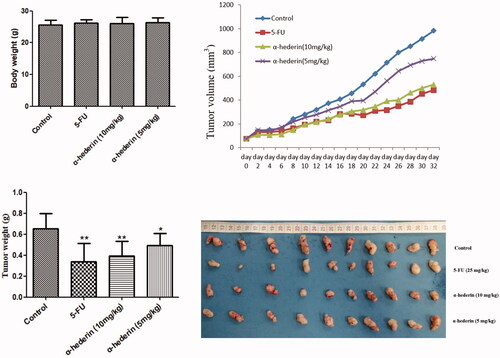

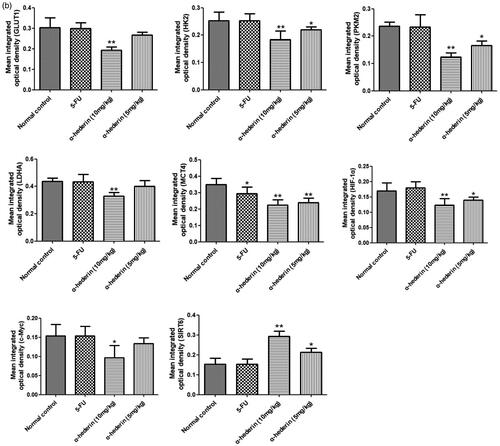
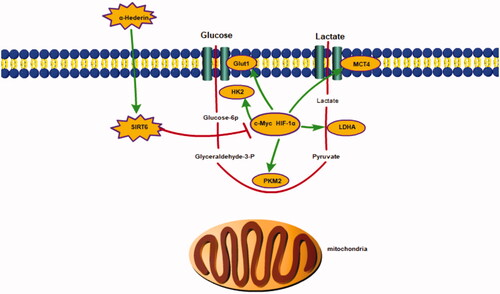
Figure 9. α-Hederin inhibits the growth of lung cancer A549 by decreasing SIRT6 dependent glycolysis.