Figures & data
Figure 1. Cell viability of SW480 cells after exposure to 0–8 μM of BBR for 12, 24 and 48 h, respectively. The results are expressed as the means of three independent experiments.
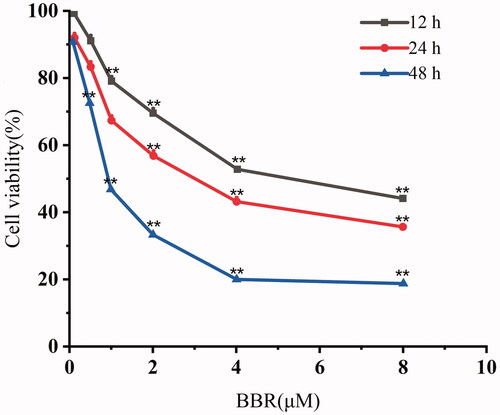
Table 1. Cytotoxicity effects of BBR on cancer cells (IC50 μM).
Figure 2. BBR induces cell apoptosis in SW480 cells after 24 h of treatment. (A) Nuclear morphological changes of SW480 cells after 33342 staining. (B) BBR induced apoptosis in SW480 cells. (C) The mitochondrial membrane potential changes of SW480 cells. (D, E) Quantification results of apoptosis and MMP changes in SW480 cells are both expressed as the means ± S.D. for three independent experiments, *p< 0.05, **p< 0.01 vs. untreated control. (F) Western blot analysis of Bcl-2, Bax, c-Caspase-9, c-Caspase-3, PARP in BBR treated SW480 cells.
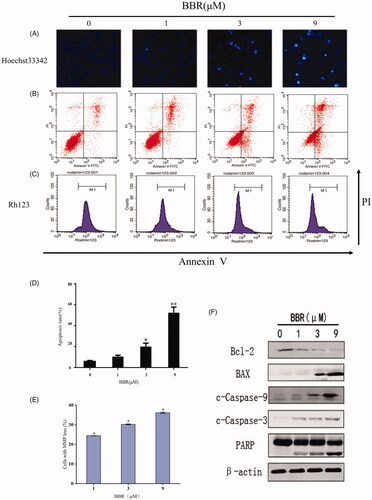
Figure 3. The relative densities of protein bands normalized to β-actin. (A) The relative protein densities of Bax, Bcl-2, Caspase-9, Caspase-3 and PARP. (B) The relative protein densities of p-PI3K, p-AKT, p-mTOR (2448) and p-mTOR (2481). (C) The relative protein densities of cyclinD1, CDK4, LC3-I and LC3-II. (D) The relative protein densities of Jagged1, Notch1, NICD, Hes-1 and PTEN. Data shown are mean ± standard deviation of three independent experiments. *p < 0.05, **p < 0.01 when compared to the control.
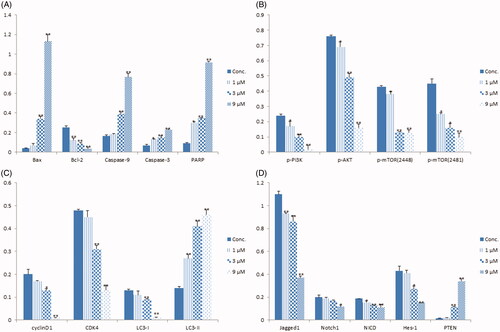
Table 2. Expression signatures of CMAP drugs most positively with that of BBR.
Figure 4. BBR did not inhibit Hsp90 and HDACs in SW480 cells. (A) The binding effect between BBR (100 μM) and Hsp90 was detected by the thermal stabilization-based CESTA method at 48–76 °C after 30 min of incubation at room temperature. (B) Hsp90 protein expression was quantified and the data are presented as means ± S.D. of three independent experiments. (C) Western blot analysis of Hsp70, IKKβ and EGFR in BBR treated SW480 cells after 24 h incubation. The Hsp90 inhibitor 17-AAG was included as positive control. (D) Western blot analysis of HDAC proteins in BBR treated SW480 cells after 24 h incubation.
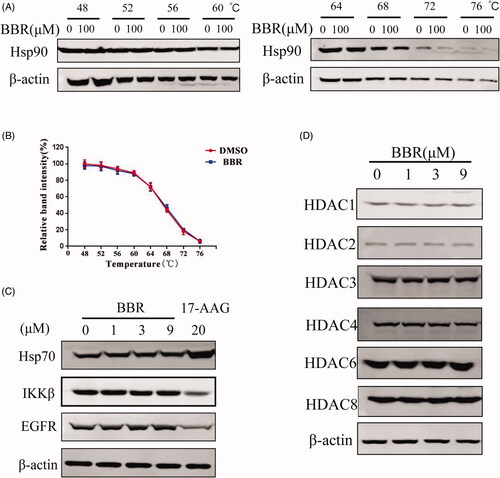
Figure 5. BBR enhanced the anti-proliferative activity of 17-AAG and SAHA, and the combination of the three has more potent synergistic effect on SW480 cells. The incubation time of SW480 cells and the test drugs was 24 h. (A) SW480 cells were exposed to specified concentrations of 17-AAG for 24 h in the presence of 0–2 µM of BBR. (B) The CI values of BBR and 17-AAG combinations. (C) SW480 cells were exposed to specified concentrations of SAHA for 24 h in the of 0–2 µM of BBR. (D) The CI values of BBR and SAHA combinations. (E) SW480 cells were treated with specified concentrations of 17-AAG and SAHA in the presence of 0–2 µM of BBR. (F) The CI values for BBR, 17-AAG and SAHA combinations. The above data are all presented as the means ± S.D. of three independent experiments. *p< 0.05, **p< 0.01 when comparing with 17-AAG, SAHA and both 17-AAG and SAHA treatment in the absence of BBR.
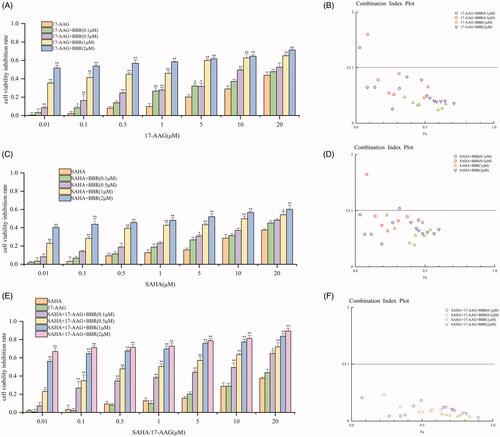
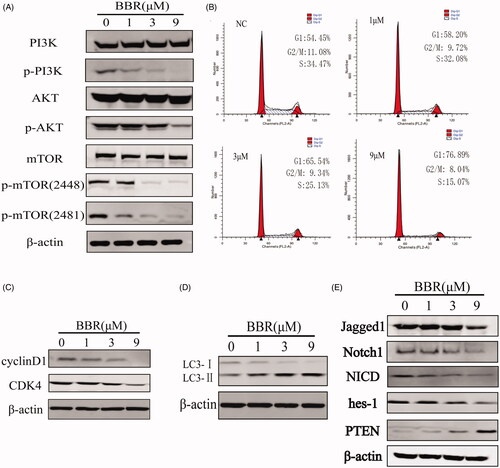
Figure 6. BBR targets the Notch1/PTEN/PI3K/AKT/mTOR pathway, arrests cell cycle and induces autophagy in SW480 cells after 24 h treatment. (A) The total and activated protein levels of PI3K, AKT, mTOR in BBR treated SW480 cells were determined by Western blot. (B) Flow cytometry analysis of cell cycle distribution in BBR treated SW480 cells. (C) Proteins expression of cell cycle related proteins cyclinD1 and CDK4. (D) Proteins expression of autophage related proteins LC3-I and LC3-II. (E) Proteins expression of Jagged1, Notch1, NICD, hes-1, PTEN and β-actin in BBR treated SW480 cells.