Figures & data
Figure 1. The cell viability of tumour cells and NK cells. (A) A549, (B) H1299 and (C) NK cells. Data represent mean ± S.E.M. *p< 0.05; **p< 0.01; ***p< 0.001.
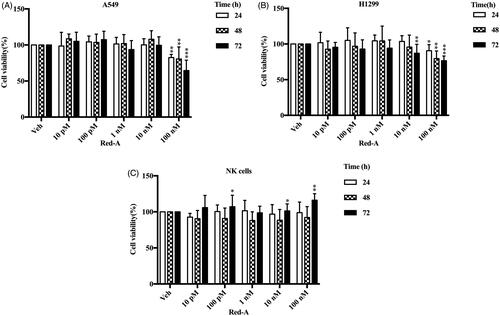
Figure 2. Red-A enhances NK cell-mediated killing of tumour cells. (A, B) The biophotonic cytotoxicity assay and (C, D) impedance assay were performed. E:T represents the ratio of effector cells vs. target cells. Data were pooled from three donors. Data represent mean ± S.E.M. *p< 0.05; **p< 0.01; ***p< 0.001.
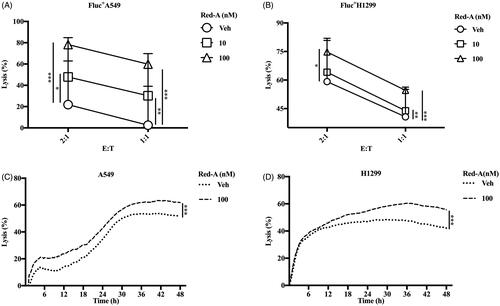
Figure 3. Red-A increases degranulation of NK cells. (A, B) Pre-treated A549 or H1299 cells were co-cultured with NK cells while (C, D) pre-treated NK cells were co-incubated with A549 or H1299 tumour cells. (A, C) Data represent three independent experiments while data (B, D) were pooled from three independent experiments. Data represent mean ± S.E.M. **p< 0.01. NS: non-statistical significance.
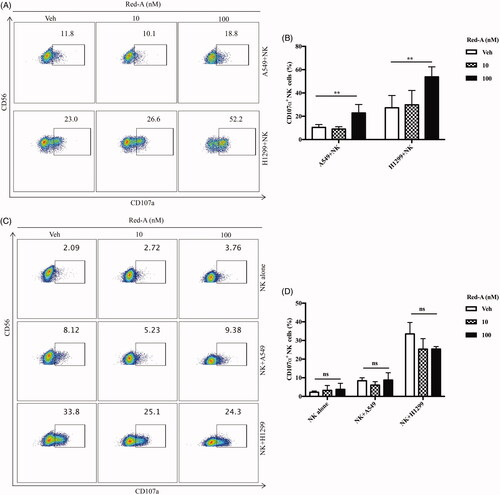
Figure 4. Red-A increases the secretion of IFN-γ. (A, B) NK cells were co-incubated with A549 or H1299 tumour cells in the presence or absence of Red-A, and then IFN-γ was detected by ELISA assay. Data were pooled from three independent experiments. Data represent mean ± S.E.M. *p< 0.05; **p< 0.01.
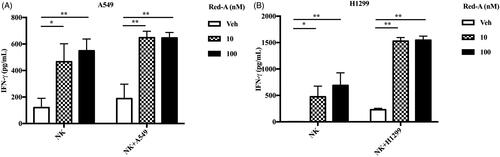
Figure 5. Red-A increases the releasing of granzyme B. (A, B) A549 or H1299 cells were co-cultured with NK cells in different concentrations of Red-A, then granzyme B level in A549 and H1299 tumour cells was assessed. Data A are a representative of three independent experiments while data B were pooled from three independent experiments. Data represent mean ± S.E.M. ***p< 0.001.
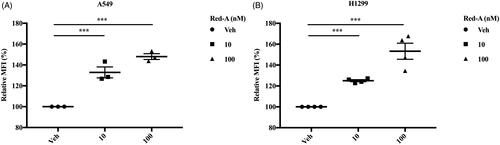
Figure 6. Red-A enhances the conjugation of NK cells and NSCLC cells. (A, B) The population of Far Red/calcein double positive cells was detected by flow cytometry to determine the conjugation of NK cells and tumour cells. Data A are a representative of three independent experiments while data B were pooled from three independent experiments. Data represent mean ± S.E.M. ***p< 0.001.
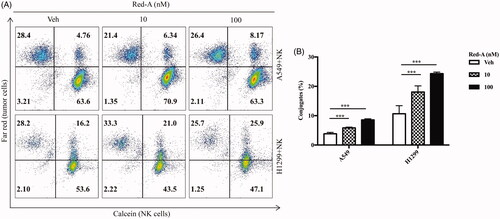
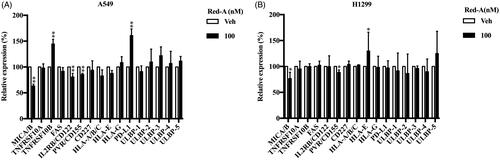
Figure 7. Red-A down-regulated CD155 expression level. (A, B) The activating ligands, inhibitory ligands and death receptors of NK cells were analysed by flow cytometry. Data were pooled from three independent experiments. Data represent mean ± S.E.M. *p< 0.05; **p< 0.01.