Figures & data
Figure 1. Experimental scheme. (A) Chemical structure of tanshinone IIA. (B) Schematic representation of AOM/DSS-induced colitis-associated colorectal tumorigenesis modelling in mice.
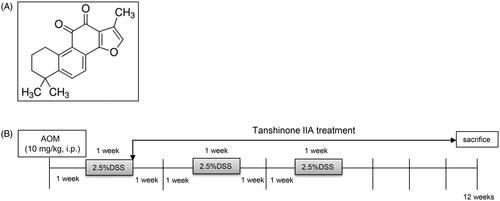
Figure 2. Inhibitory effects of tanshinone IIA on AOM/DSS-induced colorectal tumorigenesis in mice. (A) Representative luminal views of the colons from AOM/DSS-treated and AOM/DSS + tanshinone IIA-treated mice. (B) Quantification of colonic tumour volume in AOM/DSS-treated and AOM/DSS + tanshinone IIA-treated mice. Error bars represent the mean ± SD (n = 6 for each group). *p < 0.05 indicates a significant difference between mice. (C) Representative histopathological images of colon from control mice, mice treated with AOM/DSS or AOM/DSS plus tanshinone IIA. Tanshinone IIA significantly inhibited colorectal tumour formation and inflammatory cell infiltration in AOM/DSS-treated mice.
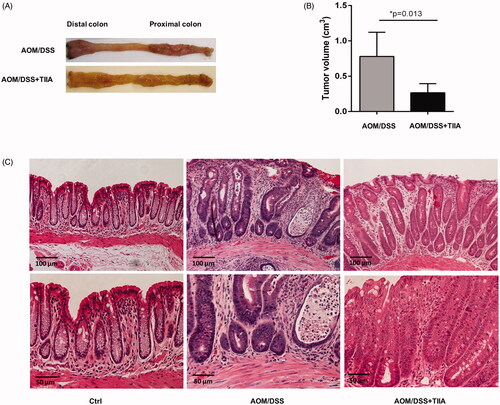
Figure 3. Tanshinone IIA improved intestinal permeability and reduced intestinal neutrophil infiltration. (A) Serum concentrations of FITC-dextran in AOM/DSS- and AOM/DSS + tanshinone IIA-treated mice were measured to assess intestinal permeability. Error bars represent the mean ± SD (n = 10 for each group). (B) Ly6G-positive neutrophil infiltrates in colonic sections from control mice, AOM/DSS- and AOM/DSS + tanshinone IIA-treated mice. (C) Positive staining areas per high-powered microscopic field (10×) were quantified based on six sections from three independent mice from each group. Error bars indicate the mean ± SD.
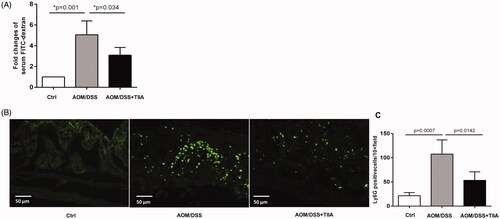
Figure 4. Tanshinone IIA inhibited intestinal inflammation in AOM/DSS-treated mice. (A) Colonic MPO activity (B) Colonic ROS levels were significantly elevated in AOM/DSS-treated mice, whereas tanshinone IIA markedly reduced their levels (mean ± SD, n = 6 for each group). (C) Multiple inflammatory cytokines were increased in the colonic tissues of AOM/DSS-treated mice when compared with their levels in the controls (*p < 0.05). Tanshinone IIA treatment decreased most of the detected cytokines (IL-6, IL-17A, INF-γ, TNF-α) in mice treated with AOM/DSS (#p < 0.05).
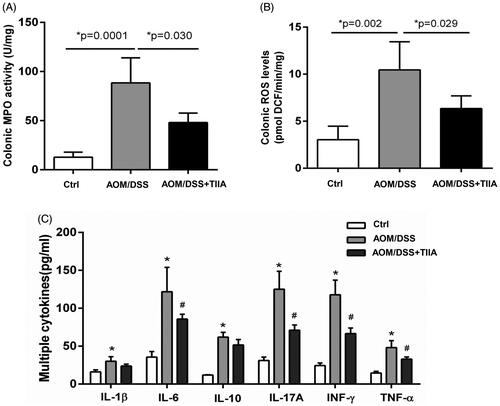
Figure 5. Tanshinone IIA downruglated the NF-κB signalling pathway. AOM/DSS treatment promoted the phosphorylation of p65-NF-κB and IκBα in colonic tissues of the mice, whereas administration of tanshinone IIA significantly inhibited activation of the NF-κB signalling pathway. β-Actin was used as a loading control. Data are representative of at least three experiments.
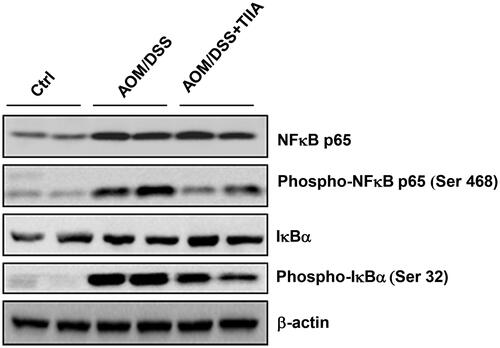
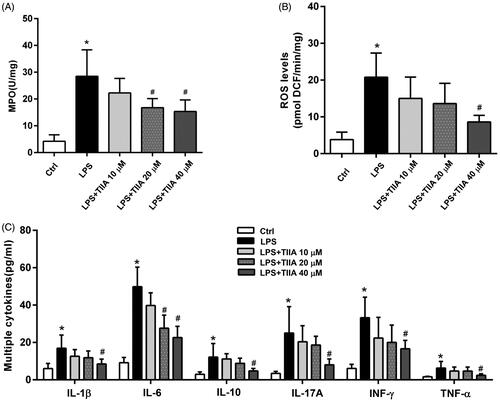
Figure 6. Tanshinone IIA suppressed neutrophil activation in vitro. (A) Isolated murine neutrophils showed a significant increase in MPO activity when treated with LPS, whereas coincubation with tanshinone IIA markedly inhibited MPO activities. (B) LPS-stimulated neutrophils produced high levels of ROS, whereas coincubation with tanshinone IIA markedly decreased ROS levels. (C) LPS-stimulated neutrophils produced high levels of cytokines (IL-1β, IL-6, IL-10, IL-17A, IFN-γ and TNF-α, all *p < 0.05 vs. the control cells), whereas coincubation with tanshinone IIA markedly decreased the levels of various cytokines in a dose-dependent manner (#p < 0.05 vs. LPS-treated cells). Experiments were repeated at least three times. Error bars represent the mean ± SD.